Analytics | Feature
Page 3 of 3
A Collaborative Tool for Retention
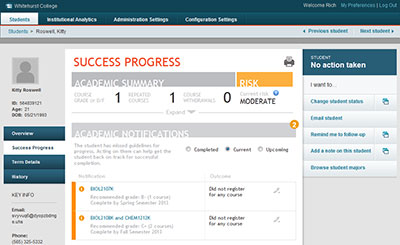
The Student Success Collaborative analytics dashboard |
John Nicklow, provost and vice chancellor for academic affairs at Southern Illinois University, wants to see a nearly 10 percent leap in his school's retention rate over the next three years. That's a dramatic increase in the number of full-time, first-year students who will return for another year each fall.
To make it happen, the university is working on multiple fronts. An array of "action teams" are addressing advising, early alerts, engagement, mentoring and more. Plus, the university has made changes in a number of areas: academic policies; a transition to multiyear scholarships; a push to improve student learning in math; block scheduling; the use of a response team to reach out to students on probation; and a new resource center to help students get answers to their questions.
But the secret weapon Nicklow is most intrigued by right now is the "Student Success Collaborative," an initiative from the Education Advisory Board (EAB) that mixes a predictive analytics tool with one-on-one consulting and cross-institutional networking to help identify and intervene with at-risk students.
Although SIU's membership in the collaborative is still fresh — a little over a year old — the impact is already noticeable, according to Nicklow. Term-to-term retention for first-time, full-time students rose from 83.1 percent in the 2012–2013 academic year to 86.7 percent the following year. "We've actually increased that retention rate by 3.7 percent," Nicklow declared. And those additional 85-plus students represent $988,000 in regained tuition.
What's more, in the same time period the average student GPA went from 2.5 to 2.65, and the completion rate went from 81 percent to 84 percent. "Everything is going in the right direction," said Nicklow. "Things that need to happen are happening."
Accelerating Analytics on Campus
Nicklow could safely be called a data geek: His engineering background is in optimization of complex systems. "If enrollment isn't a complex system," he observed, "I don't know what is."
SIU is an access institution with 51 percent Pell recipients among freshmen, a demographic that comprises more than one-quarter under-represented minorities and a sizable number of first-generation students.
The university had been tinkering with some of its own analytics and predictive work to inform its retention struggles, but the effort was "incredibly time-consuming," recalled Nicklow. Upon looking at what EAB was doing in conjunction with other institutions, he saw a way to accelerate SIU's analytics efforts.
The Advisory Board Company, the public entity behind EAB, actually started out in the 1970s with a model of conducting research on any question for any organization (its current focus is on healthcare and higher education). In the area of education, the organization runs memberships or "forums" that drill down into specific areas — academic affairs, advancement, business affairs and so on. The Student Success Collaborative is one of these, and it currently counts about 100 higher ed institutions as members — large and small, public and private, research and masters all represented. Members are provided with best practices advising, research studies, in-person member meetings, web conferences and onsite services.
When a new member joins, EAB staff members go to the campus to meet with participants, begin training and develop a feed from the student information system to a cloud-based data warehouse. SIU provided 12 years' worth of data up front that's now added to every night. Setup took about a year, Nicklow said, including the process of having each program identify its milestone courses and unique characteristics that would allow the model to recognize distinct programs amidst the data. Once the data is fully made available to EAB, analysts perform regression modeling to uncover trends.
When a Passing Grade Is "Really Bad"
SIU's 50 or so academic advisers are now armed with the Student Success Collaborative's analytics tool, built around a statistical model specific to the institution. Student profiles are displayed on a dashboard showing various details, such as D/F/withdrawal counts, repeated courses, cumulative GPA, total credits and an assessment of current risk — low, moderate or high.
Nicklow explained the adviser process this way: An engineering student walks in after his first year of classes. He has failed calculus twice and really doesn't like it, but parental pressure has driven him in that direction. Using the tool, the adviser will be able to say, "In the past 10, 12, 15 years, for every student who has failed calculus twice, here's their chance of success."
For an experienced adviser, figuring out the perils in store for high-risk students is almost intuitive. But there are other populations of students who may be at risk in less obvious ways — a group EAB calls the "murky middle." These students may not realize they're heading in the wrong direction; they may have gotten a C in that calculus class. Sure, that passing grade might make the students think "they're doing fine," said EAB Senior Director Ed Venit. "The advisers [may] also think they're doing fine. [But] our data [may suggest] that C grade is actually really bad — not for passing the course, but for the next course. They really didn't develop the foundation knowledge, they didn't collect everything they needed to learn, not to pass the 101 class but to pass the 102 class. The number of different times we've seen that come up, it's really astounding."
When an adviser shares a negative outlook with a student, the conversation can go in several ways. It can provide a wake-up call to the student to work harder, said Nicklow; or it can compel him or her to choose a different pathway. The tool can help steer students toward areas that match their interests but are better aligned with their skills, he added.
Or a student can react the way one optimistic teen did: "Really? I have a five percent chance of passing? I can do this! I'll be part of that five percent!"
The tool helps generate a more engaging and interactive conversation between student and adviser, and that conversation can make a concrete improvement in retention. SIU found that the retention rate for "murky middle" students went up six percent when they interacted with an adviser using the collaborative analytics tool.
A Better Advising Session
SIU's advisers have gone through extensive training to learn how to use the technology and lead those data-informed discussions with students. The use of analytics hasn't lengthened the amount of time advisers spend with any single student nor has it created an advising bottleneck. In fact, reported Nicklow, "It actually reduces that because you now have the data and can show the students very quickly about things that your gut [may have been] telling you."
Also, as Venit pointed out, the analytics can help optimize and focus advisers' efforts: "What population of students do advisers need to make sure they absolutely see? Some of those populations are obvious to them. But some of them aren't. What we're able to bring to the table and say [is], if you can only meet with 200 students this semester, these are the 200 you need to meet with."
Advisers aren't the only ones who benefit from the program, he added. "If you're the provost, you can look across every college and, at a glance, get a sense of how are the colleges doing. Green, yellow, red. How are they trending across time and why," said Venit. "The analytics can expose 'bottleneck' courses. Are there sections with high D/F/W rates? Why? If you're flagging at-risk students — let's say business majors — are they getting flagged for the same reason? Maybe there's a systemic issue you ought to be addressing."
SIU is expanding the use of the tool to other areas. For example, the university has 21 military off-site locations around the country that will gain access to analytics. Advisers and coaches in athletics and all department chairs are also on the list.
The analytics work is becoming a vital force for pushing the dial on retention, said Nicklow. "The data from the Student Success Collaborative is very good," he noted. "But it's a tool that facilitates so much more engagement and interaction and in a very positive way. It facilitates a far better advisement experience."
|
The "Slow Bleed" Problem
The retention question is often focused highly on first-year students, but that "conventional wisdom" may need rethinking, according Ed Venit, senior director for the Education Advisory Board. "When you look at the data, the students who dropped out in the first year really fall into two categories. You have students who are baseline — maybe they're homesick; maybe this wasn't the right school for them. [It's a] relatively small population. And then you've got a massive number of students who are academically adrift. They're failing; they're below a 2.0 GPA; and they largely don't come back."
What schools have under-appreciated, he added, "is how many students drop out after that. It turns out a really large number of students — perhaps 40 to 50 percent — at an individual institution are actually dropping out after the first year. You have a long time to work with these students. But they've largely been overlooked, because of this emphasis on the first year."
He calls this segment the "slow bleed." The Student Success Collaborative has made a strong push to "point schools in that direction," he said. "You really want to have a comprehensive strategy and be looking at these students who are dropping out later on." Their troubles are different, such as not completing courses, not completing them early enough, not withdrawing, repeating courses.
|
About the Author
Dian Schaffhauser is a former senior contributing editor for 1105 Media's education publications THE Journal, Campus Technology and Spaces4Learning.

