Data Analytics
A Simple DIY Approach to Tracking and Improving Student Learning Outcomes
A professor and former dean of performance excellence at San Antonio College uses Excel data to inform his instruction and achieve better learning outcomes for his students.
- By Dian Schaffhauser
- 05/20/15
As the director of institutional research and then dean of performance excellence at San Antonio College, David A. Wood, Jr. had the capacity to use all kinds of sophisticated modeling and statistical tools and techniques to help measure and influence student learning outcomes. Now that he's back to teaching astronomy at the college (a move he's "ecstatic" about), he has turned to a self-created Excel spreadsheet to manage the data he needs to improve learning outcomes for the students in his own classes.
Wood's basic approach has increased scores on tests by five to 10 points, he said. More importantly, the quality of the types of questions students are asking in class suggests they're understanding more about the topics being covered. Best of all, his technique is easily replicable by any instructor who cares to test it out. Those who have tried are big fans.
The Magic Formula
As an associate professor of astronomy, Wood teaches a course about the solar system. During that class, which he teaches both face-to-face and online, he gives two midterms and a final exam to assess what his students are learning. Those tests aren't "gimmes" — Wood said that he makes "some of those exam questions particularly challenging," in order to force his students to do critical thinking.
Here's Wood's magic formula: He tracks how each student does with each test question and performs an item analysis after each exam, which tells him "right away" where his students have understanding and where they're struggling. Having those results tells the faculty member where he needs to put the emphasis in the next section of the course.
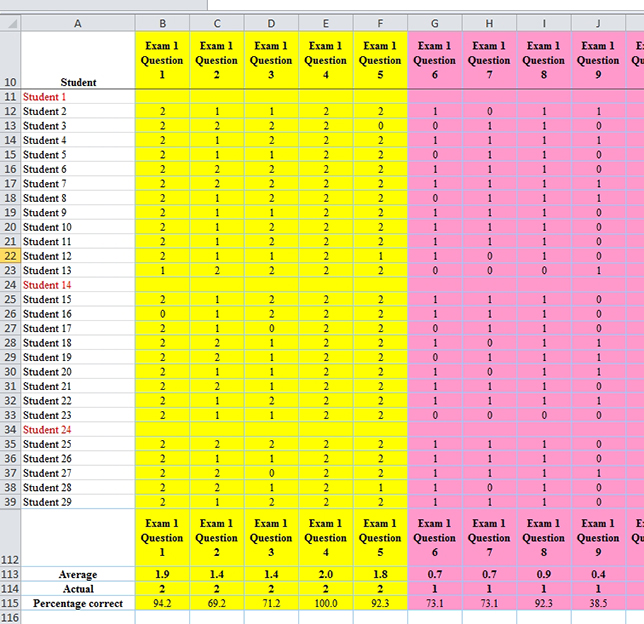
Wood tracks students' scores for each exam question across all three exams in his course.
"If we are struggling, for example, with the concept of 'escape velocity,' then I know when we are talking about atmospheric escape in the second third of the course, I'm going to have to go back and talk about escape velocity again. I bring those pieces back so that we hit them again," he said.
While the course has "four or five" official learning outcomes, Wood himself uses nine learning outcomes, of which the official ones make up a subset. At the end of the term Wood uses a summation of what students have demonstrated on the three exams to tell him which outcomes they've mastered.
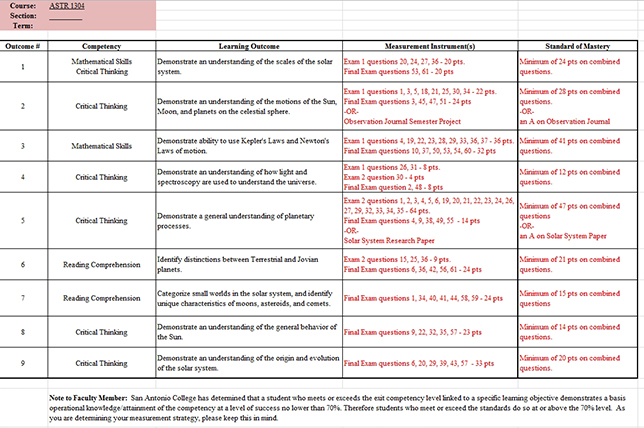
Each exam question is linked to a given learning outcome set for the course both institutionally and by the instructor.
The same spreadsheet that monitors how students did individually against the exam questions also tracks how they do against the learning outcomes. That information goes into an institutional system for cross-campus tracking.
As Wood explained, "When students accumulate enough between [exams] to demonstrate the mastery of the concept, my Excel spreadsheet turns on an 'x' in that particular box for that student." That's translated into eLumen, the college's learning outcomes tracking software.
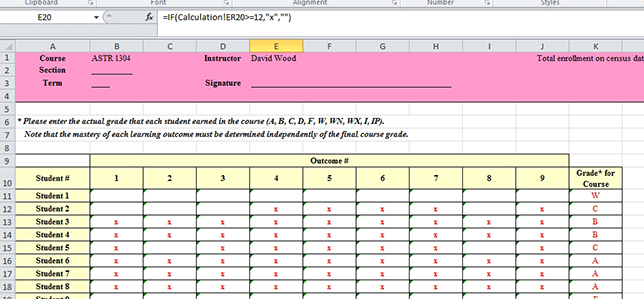
As a student achieves a learning outcome, as proven by the questions he or she has mastered in the exam, an "x" goes into a worksheet cell.
How the Data Gets Used
When it's obvious from exam results that enough students have gone off track, Wood knows that he needs to retrace ground. He'll refine his lectures; use new images; come up with new analogies. Sometimes it's just a matter of reintroducing topics in a new context.
As he noted, "In that first third of the class, we're introducing what I call the toolbox — the tools that students are going to need later in the course; but we haven't necessarily contextualized why that particular tool was important. Often, injecting that tool again — even if it's taught the same way but now in context — helps students get a better understanding of why we were doing that. Sometimes the context itself may lend to a better or a new angle at which to talk about that particular topic."
There are also instances when Wood takes up a new instructional practice in order to spark better understanding. This semester he introduced the use of teams for solving equations. The change came about "on the fly" when he'd seen that on homework assignments that involved calculations, three-quarters of the students were leaving those questions blank. "They didn't even attempt them," he recalled.
Now he breaks students into groups and has them do sample calculations. "Part of that is to keep my higher-level students engaged. And part of it is to force those students who would just otherwise ignore the calculations altogether to ask questions and maybe figure it out along the way."
The result is that more students are attempting the calculations on both the homework and the exams. "They're still not quite getting it correct," he said. "But at least a good chunk of them are writing the correct equations down now, which is more than they were doing before."
To reward students for their efforts, he follows a generous partial credit policy. "If they start Kepler's third law with 'P2/a3' and they don't touch it any more, they get 50 percent because at least they knew which equation to start with," he said.
Wood expects to add a calculation question on the final exam to find out how much of the earlier team exercises "really stuck." If the technique works, that's a practice he'll continue in the future. If it doesn't work, he'll have to "figure out some other strategy to bring that back to the forefront later in the semester — to keep that bubbling to the top of students' minds during the semester."
Providing Proof
The results of Wood's efforts show up in the data. The scores for the first exam in his course have improved "over the years" by about five to 10 points, he said. Scores for the second exam have gone up by about 10 points. "It's not just the format of the exams," he added. "It's students actually learning, which you can qualitatively see in the types of questions they're asking in class. The questions have become more probing, more direct. The language they're using to talk about the subject is much more appropriate. They've got a better grasp of the jargon."
During his previous job as dean, Wood would share his techniques with other faculty members. While some would roll their eyes at the sheer simplicity of it, others became converts.
An instructor in the art department taught himself Excel over the summer and came back "absolutely fascinated" by what he was able to glean from results of tests and homework, said Wood. "Now he actually understood the data was that was coming out of his report, and he built that sheet for all of his adjuncts."
In another instance, a "reticent" computer science instructor sat through an hour-long presentation Wood gave on the technique and at the end said, "I don't understand why we haven't done this all along."
All it takes, Wood emphasized, is a willingness on the part of the instructor to "look into exam questions. If only five percent of students get it, then is the question a fair one or is it not phrased correctly?"
Wood's main message is this: The educator doesn't have to make big changes to what he or she is doing, but simply to "watch the data as you go along. A small investment in time can reap really big rewards in student learning and student outcomes."

