Scanning the Dashboard
Managing myriad institutional goals and objectives is complicated. Dashboard software can provide top-level metrics at a glance, with easy access to more detailed data below the surface.
- By Dian Schaffhauser
- 02/24/11
When Anne Kress became president of Monroe Community College in June 2009, she inherited a 27-page strategic plan bursting with 36 goals and 111 objectives--not to mention a generous sprinkling of key performance indicators for students, including program-by-program rates for graduation, transfers, job placement, and retention.
If Kress had been forced to wade through all of that each time she wanted to check on her school's performance, the 19,000-student institution might easily have lost its way. Instead, says Angel Andreu, Monroe's director of institutional research, the new president wanted a way for her four vice presidents to monitor a handful of the most crucial KPIs, while still having the ability to drill down into the details behind the numbers. Setting it up this way, she believed, would allow them to make better decisions.
| In "Putting the Focus on Performance," in the March issue of Campus Technology, we examine how two universities are using comprehensive, data-driven systems to assess their departments--and improve student performance. |
But what exactly should be measured and when? What is most important? Based on input from her vice presidents, the president identified four top-level metrics--tied to access, success rates, financial matters, and quality--that would provide an instant read on the health of the college. It was Andreu's job, working with an IT colleague, to identify a tool to display these metrics in an understandable way. He was already supplying PDF reports with institutional data, but there was no easy way for administrators to get at the details they needed to make decisions.
"They'd have to think of the questions ahead of time," Andreu explained. "I'd have to prepare the information, and it would be [in the form of] handouts." Frequently, the data would generate additional questions that required another round of reporting by Andreu and his team.
Supplying administrators with a dashboard, on the other hand, promised to be more dynamic. "They could think of follow-on questions and do drill-downs on their own," he added.
Off-the-Shelf Options
Starting in spring 2010, the Institutional Research and Educational Technology Services departments evaluated off-the-shelf dashboard software that could be implemented quickly. The groups narrowed their choices to three products, including one from the same company that provides Monroe's analytics application. Each company gave a demonstration of its application, but the college wanted to see what was required behind the scenes to create multilayer dashboards.
"We created a data file in Excel, sent it to the three companies, and said, 'OK, develop us a dashboard based on the data, then show us how you put it together,'" Andreu recalled. "We wanted to measure how easy or difficult it would be. We had a second meeting in which we watched how each company developed what they did and what each dashboard looked like."
All three companies took different approaches to setting up the data and defining the gauges that would appear on the dashboard, Andreu said. But Monroe was looking for a dashboard product that didn't have a big learning curve, plus Andreu was on a tight deadline. "We had to find something that we could work on without it interfering with everything else we had to do," he explained. A secondary goal for Andreu was to implement a system that could relieve his staff of the burden of fielding standard research requests that covered the same ground over and over.
After putting all three products through their paces, the college chose iDashboards from a company of the same name. "It looked straightforward and easy to use," said Andreu. "It looked like the kind of dashboard we were envisioning."
By October 2010, the software was installed on a campus server (although it's also available as software-as-a-service), and IR and technology people began their training. By the third day of the course, said Andreu, participants were designing their own dashboards and pulling data out of Excel and Oracle tables.
"We weren't scratching our heads," he recalled of their initial attempts to compile a compelling dashboard. "We knew what our leadership wanted to see in the measures and key performance indicators. We just had to find an efficient tool."
Building & Evolving the System
From the top-level view, the user can drill down to show increasingly granular data. For example, Andreu said, "If you were in the access speedometer, you would have metrics on enrollment trends by demographics, by program, by high school. If you looked at financial aid disbursement, you could drill down by time, and also break that down by ethnicity and age group and then scholarships, grants, loans, and amounts."
For this first iteration of the system, the data isn't actually "live." As the data sources change, the dashboards don't reflect those changes--at least, not yet. To keep the initial implementation simple, Andreu said, he plans to load new data as college terms roll over. Automation may not be far behind, however. "We've found ways through SQL to update those dashboards automatically," said Andreu. "All you need to do is update a new set of data and iDashboards takes care of it."
As the dashboard project unfolded, Andreu kept the college president apprised of its progress, including a preview demonstration in spring 2010. Then, in October, he showed her some of the dashboards produced from the training. "We wanted to see if we were going about it the right way and to [find out] how far back in history we should go," he said.
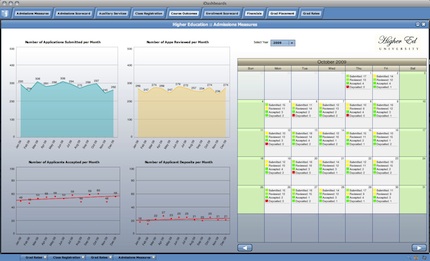
A sample higher education dashboard in iDashboards showing various "admissions measures." An interactive demo can be accessed directly here. |
Based on her feedback, the project team agreed to complete the implementation by Dec. 3, allowing the president to use the dashboard system in a presentation to the college's board of trustees at its fall meeting. In the lead-up to that presentation, the IR and technology teams developed about 30 dashboards with 120 to 150 charts. The main dashboard shows just four speedometers, displaying the key metrics identified at the very beginning of the project.
Now, IR and Educational Technology Services plan to introduce the dashboard system to other areas of campus. "The first goal was to show it to the president and staff," said Andreu. "They found it to be very useful. So now we'll roll it out to the next layers--the vice presidents, directors, and some deans."
The technology team has begun working with some of the directors to tailor the dashboards to their departments' particular functions. For example, "The admissions office wants to see updates weekly or daily on enrollments," explained Andreu. "They'll be able to drill down to tell which high schools students are enrolling that week without having to look through PDF reports."
In setting up the dashboard system, Andreu acknowledged, he was also forced to put his own house in order. "To make this dashboard work, we had to reorganize a lot of the data we had and put it in Oracle tables. That resulted in some bonuses on other projects. Today, because those tables exist, I'll take advantage of them."
As for the board, they were "very pleased," recalled Andreu--and wondering how they could get access to the dashboard software, too.
Also Worth Reading: Revving up Performance
Dashboards are growing in popularity as college administrators prepare for a new regimen of accountability. Dashboards Deliver Data Visually at ASU
Arizona State University uses software from Corda Technologies with its Oracle data warehouse to generate dashboards for faculty and staff. Wayne State University (MI)
A custom-built dashboard at WSU provides faculty and grant administrators with a seamless tool for managing grants and accessing real-time data. |