Institutional Assessment: The Art of Self-Reflection
As the technology continues to improve, colleges and universities devise new ways of mastering institutional assessment: some vendor-based, some homegrown, some combinations of both.
 METAPHYSICALLY SPEAKING, the idea of self-reflection
has been the subject of discussion for thousands of years. There are mentions of it in
the Bible. Socrates, Plato, and Aristotle spoke of it in Classical Greece. The idea carried
human beings through the Renaissance, and an entire movement tied to it sparked
a sociopolitical movement called the Enlightenment. In more recent times, thought
leaders such as Immanuel Kant, Karl Marx, and Sigmund Freud all have opined on
the subject of our ability to look inside ourselves and act accordingly. It is, as Kant
once wrote, the very thing that makes humans “rational animals.”
METAPHYSICALLY SPEAKING, the idea of self-reflection
has been the subject of discussion for thousands of years. There are mentions of it in
the Bible. Socrates, Plato, and Aristotle spoke of it in Classical Greece. The idea carried
human beings through the Renaissance, and an entire movement tied to it sparked
a sociopolitical movement called the Enlightenment. In more recent times, thought
leaders such as Immanuel Kant, Karl Marx, and Sigmund Freud all have opined on
the subject of our ability to look inside ourselves and act accordingly. It is, as Kant
once wrote, the very thing that makes humans “rational animals.”
The art of self-reflection is alive and well in academia today. College and university
administrators apply the same philosophical tenet to their own operations,
utilizing a variety of methods to figure out how to maximize efficiencies and minimize
waste. By reflecting on their priorities, goals, and processes, schools can get
a better sense of important quantifiable data such as student matriculation, average
class size, employee benefits spending, financial aid awards, and research dollars,
to name a few of the more commonly aggregated and mined data. As an
administrator you no doubt are familiar with the process termed “institutional
assessment,” but you may not fully realize just how critical it is to your school’s
ability to meet its institutional goals and fulfill its mission, not to mention meet its
more routine—but no less essential—needs.
According to Catherine Burdt, senior
analyst for Eduventures, the Boston-based education
technology research organization,
“At a time when schools need hard
facts for purposes of budget exploration
and accreditation, these practices help
feed a culture of evidence.” Moreover,
Burdt stresses that “the more energy a
school spends on assessment, the more
that school understands how things
work best.”
And though institutional assessment
practices aren’t perfect, many of them
have helped schools get a better sense
of how performance varies over time.
What’s more—at least in some cases—
interfacing with data from the federal
Department of Education
has enabled schools to get a firm grasp
on the way their institutional performance
compares to that of their peers.
Yet, no matter how schools tackle the
issue of assessment, Michael Redmond,
VP of technology, information services,
and institutional effectiveness at Bergen
Community College (NJ), maintains
that investigating operational efficiencies
will only make schools stronger
over time.
“For just about every school, time
spent evaluating processes is a good
thing,” says Redmond, whose own institution
recently launched a three-year
initiative to move beyond the traditional
method of charting institutional assessment
by hand, via spreadsheets. “The
more familiar you are with how things
happen, the better you’ll get at making
sure that what happens is what’s best.”
In the past, in fact, staffers at most
schools carried out many assessment
functions by hand, cross-referencing
spreadsheets and other forms of paperwork
in an attempt to chart mission-critical
performance. Nowadays, however, a
growing number of schools are embracing
data-driven web-based interfaces
and new data analysis techniques to ease
the process. Schools such as Texas
A&M University, the University
of Central Florida, the University
of California-Davis,
Western Washington University,
and Flagler College
(FL) are utilizing new advances
in institutional assessment tools
in order to improve performance
across the board. While some of
these colleges and universities are
using homegrown systems, others
have turned to the vendor community
for help.
Going It Alone
Interestingly, many of the most notable
advancements in institutional assessment
are proprietary. At Texas A&M, for
instance, technologists have developed a
homegrown database, based on Microsoft Access, in order to
chart institutional performance by keeping
tabs on what’s happening with faculty
members. The database, which users
can access from a web-based interface,
tracks various statistics about faculty productivity
for publishing, grants, awards,
editorships, classes taught, and graduate
students completed. University administrators
utilize data from the program to
evaluate individual programs, certain
clusters of departments, and sometimes even the school as a whole.
The Heart of It All
 Comparing your data against that from NCES? Here’s what you should know.
Most schools that engage in institutional assessment compare data of their own against data from
the National Center for Education Statistics, a division of the Department of Education. All of the
information that g'es in and out of NCES runs through one
program—the Integrated Postsecondary Education Data
System, or IPEDS — which collects,
sorts, analyzes, and distributes data on demand.
Comparing your data against that from NCES? Here’s what you should know.
Most schools that engage in institutional assessment compare data of their own against data from
the National Center for Education Statistics, a division of the Department of Education. All of the
information that g'es in and out of NCES runs through one
program—the Integrated Postsecondary Education Data
System, or IPEDS — which collects,
sorts, analyzes, and distributes data on demand.
Specifically, IPEDS is a system of surveys designed to
collect data from all primary providers of postsecondary
education. It is built around a series of interrelated surveys
to collect institution-level data in such areas as enrollment,
program completions, faculty, staff, and finances. This data
is collected and disseminated through a web-based interface
called the IPEDS Peer Analysis System.
IPEDS is nothing new; the Higher Education Act of 1992 mandated
that schools complete IPEDS surveys in a timely and accurate manner,
and NCES started data collection the following year. Between 1993 and 2000,
NCES continually improved the IPEDS data collection instruments and the list of institutions
surveyed. Then, in 2000, data collection was converted from a paper-based to a fully
web-based system.
Elise Miller, program director of the Postsecondary Institutional Studies Program at NCES,
says IPEDS supersedes the Higher Education General Information Survey (HEGIS), a similar set
of surveys that collected data from 1965-1986, from a more limited universe of accredited
institutions of higher education.
“In addition to approximately 3,600 HEGIS institutions, IPEDS includes many schools that are
not accredited, and institutions providing postsecondary training in occupational and vocational
programs, including proprietary schools and institutions,” she says. “This expanded universe
consists of some 6,800 postsecondary education providers.”
Most recently, IPEDS added the IPEDS College Opportunities Online Locator, or IPEDS COOL. The site is designed to help students and their parents understand
the differences between colleges. Users can select colleges based on location, program, or degree
offerings, and obtain information on admissions, tuition, room and board, graduation rates,
accreditation status, financial aid, and enrollment.
Feeding the database is a process that
takes all year. Becky Carr, assistant dean
for administrative services, explains that,
toward the end of every year, her department
administers to faculty members
paper-based evaluations on various subjects.
When the evaluations are complete,
a data analyst inputs the statistics
into the database, where department
heads and other administrators can
access the material on demand. Users
can view data for specific areas, or they
can employ a special feature that takes a
broader, more comprehensive look at a
variety of categories at once. The goal:
to give officials an evidentiary look at
how things are going.
“We can do several things with this
data,” says Carr, who estimates the cost
of this system as not much beyond the
annual salary of her data analyst and the
dollars spent yearly on server capacity.
“Most importantly, we get a good sense
of faculty productivity and [help with
planning] for the future.”
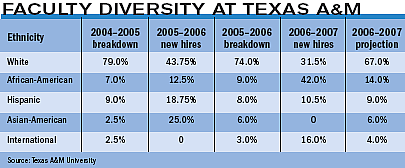
This summer, at the behest of Texas
A&M’s provost, Carr’s department used
the assessment process to investigate faculty
diversity over time. For the purposes
of this particular study, Carr’s department
established five different categories to
describe the ethnic background of new
hires: White, African-American, Hispanic,
Asian-American, and International (a
grouping that incorporated everyone
else). By tracking the ethnicities of recent
hires, the school was able to chart how the
diversity of its faculty had changed. The
results were projections for the 2006-
2007 year that indicated a sharp increase
(almost three times the increase between
2004/2005 and 2005/2006) in the number
of African-American faculty members
(see “Faculty Diversity at Texas
A&M”).
 The University of Central Florida is
also tackling institutional assessment
on its own. Under a relatively recent
mandate, approximately 200 academic
programs and 100 administrative units
are involved in conducting web-based
assessment on a yearly basis. The process
includes annual submission of a homecooked
assessment report which contains
the results of the previous year’s
assessment, proposed or actual changes
based on those results, and a new assessment
plan to measure the impact of the
changes. Julia Pet-Armacost, assistant VP
for information, analysis, and assessment,
says the system has worked wonders for
institutional effectiveness.
The University of Central Florida is
also tackling institutional assessment
on its own. Under a relatively recent
mandate, approximately 200 academic
programs and 100 administrative units
are involved in conducting web-based
assessment on a yearly basis. The process
includes annual submission of a homecooked
assessment report which contains
the results of the previous year’s
assessment, proposed or actual changes
based on those results, and a new assessment
plan to measure the impact of the
changes. Julia Pet-Armacost, assistant VP
for information, analysis, and assessment,
says the system has worked wonders for
institutional effectiveness.
“We’re certainly thinking in ways we
weren’t able to think before,” she reports
enthusiastically. “When you’re running
an institution, just this kind of thinking
alone can be priceless.”
The Hybrid Approach
At the University of California-Davis,
home-baked assessment applications
have taken on a new flavor. To monitor
the status of faculty grant proposals
from conception to completion and
approval, the school has customized its
own version of an electronic research
administration system from Inf'Ed International, says
Doug Hartline, director of technology
planning and development. Hartline
says the school is in the early stages of a
25-month rollout, but notes that when
the solution is complete, resulting
processes should save significant time
and money over the old method of submitting,
tracking, and finalizing grant
applications by hand.
“We’re weaving functions together in
order to make our entire environment
more efficient,” he says. “Over time, as
the volume of our work increases, we can
take the resources we save and dedicate
them to performing other functions.”
Western Washington University, too,
is combining an off-the-shelf solution
with one developed in-house. There,
school officials have combined backend
student, financial aid, human
resources, and advancement systems
from SunGard Higher Education with a brand-new
series of web-based Qualitative Symbolic
Reasoning (QSR) tests, to dig even
deeper into data at hand. The assessments
are part of an effort dubbed the
Western Educational Longitudinal Survey,
or WELS, and they seek to ask students
in-depth questions about their present experiences so that officials can
develop a richer picture of how the
everyday is affecting their development.
Karen Castro, associate director of
WWU’s Center for Instructional Innovation,
explains that the effort is
designed to coordinate information that
isn’t easily captured by the SunGard
product. After years of utilizing national
instruments such as the Cooperative Institutional Research Program and the
College Student Experiences Questionnaire, Castro
devised the system as a less expensive
alternative. Rich Frye, research analyst
for the Office of Institutional Assessment
and Testing, says the one-two
punch of SunGard and WELS has
proven to be an unbeatable resource,
giving WWU more data than administrators
there had ever dreamed possible.
“We distribute information to both
academic and non-academic programs,
and those programs are getting information
they have never had before,” he
says. “We believe that the better the data
we develop and provide, the better the
student experience will become.”
Leaning on Vendors
The assessment systems at UC-Davis
and WWU are a homegrown spin on a
commercial product; other schools have
relied more heavily on vendors for help.
For instance, Flagler College administrators,
long-time customers of Jenzabar, use Jenzabar EX,
an Enterprise Resource Planning (ERP)
system that collects institutional assessment
data from a variety of sources. The
system, which is entirely softwarebased,
automates much of the reporting
that school officials previously pulled
together in a manual fashion. As a
result, CIO Joseph Provenza says the
school has saved big bucks (not to mention
huge amounts of time) on gathering
business intelligence.

At Texas A&M, a homegrown database
(costing about as much annually as a data
analyst plus server capacity) helps
administrators get a solid grasp on faculty
productivity and a head start on planning.
Once the school uses its Jenzabar system
to compile in-house data on areas
such as student retention, financial aid,
faculty/student ratios, and faculty benefits,
it compares this information to data about peer institutions from the National Center for Education Statistics (see “The Heart of It All”). Randi Hagen, director of institutional
research, effectiveness, and planning,
says that on top of this, the school
utilizes a number of user-friendly electronic
assessment products from the Educational Testing Service to
tackle student performance assessment.
Using a SharePoint Portal Server from
Microsoft, Flagler distributes results
from these tests via the campus intranet.
“In the past, only a select group of
people on campus could see the limited
institutional data we collected,” says
Hagen, who notes that the school will
deploy Jenzabar’s new Jenzabar Internet
Campus Solution (JICS) later this year to
“webify” the entire process from beginning
to end. “Today, not only have we
increased our data exponentially, but as
long as you have a computer and a faculty
or staff account, you can see it all.”
Challenges Ahead
While these schools have embraced
innovative technology to facilitate institutional
assessment, the new approaches
are not without their challenges. First
is the issue of cultural change. In days
past, university assessment departments
were able to cull performance data from
paperwork that faculty members filed at
the beginning
and end of
every semester.
With some of
the new technologies,
institutions
require
faculty members
to report data more consistently.
Not only do the new demands force faculty
members to spend more time submitting
data, but these users also must
familiarize themselves with a new interface,
which takes time.
Some schools have tried to tackle this
learning curve by implementing professional
development classes to help staff
and faculty members get to know the
new technology. Others, such as Texas
A&M, have tried to deploy intuitive
interfaces to make using assessment
systems as user-friendly as possible. In
many cases, efforts like these have
yielded good results. Still, Burdt at Eduventures
says that some of the more
sophisticated institutional assessment
technologies have wreaked havoc on
schools with large departments or
departments with faculty members who
insist on blazing their own trails. “It’s
a tricky cultural
shift,” she says.
“As funding becomes
tighter,
schools are maneuvered
into a
position of having
to prove that
assessment technologies are effective,
and everyone must comply.”
Another challenge, of course, is the
quality and uniformity of the data itself.
Whenever independent colleges and universities
share information, it’s essential
that the data exist in similar formats, in
order to prevent errors and other reporting
glitches. The problem, at least today,
is that few schools seem to adhere to
those formats espoused by the National
Center for Education Statistics. Then too,
Provenza at Flagler insists that statistics
from the federal government frequently
come with errors; he says it’s impossible
to determine accurate numbers when
some of the base information is wrong.
(He adds that while his own administrators
value clean data, even they make similar
mistakes from time to time.)
AT UC-DAVIS, assessment systems
are a homegrown spin on a commercial
product from Inf'Ed International. The
rollout will take just over two years.
Finally, of course, is the issue of time
to market. Solid, battle-tested institutional
assessment programs don’t sprout
overnight; assessment endeavors need
time to settle in to the everyday ebb-andflow
of an organization before they can
make a difference. At WWU, where the
WELS solution works in tandem with
SunGard to evaluate traditional and notso-
traditional facets of campus life, university
officials experienced years of
frustration with inefficient institutional
assessment tools before they created and
sharpened a solution of their own. “It
wasn’t easy, but we’re finally happy with
the system we have in place,” says Castro.
“Now it’s up to us to use it in a way
that makes it all worthwhile.”
::WEBEXTRA:: At CT2006, panelists from
MIT discussed how to assess the effectiveness of teachingtechnologies. Listen in
here.
About the Author
Matt Villano is senior contributing editor of this publication.