Johns Hopkins Dashboard Maps Global Coronavirus Cases
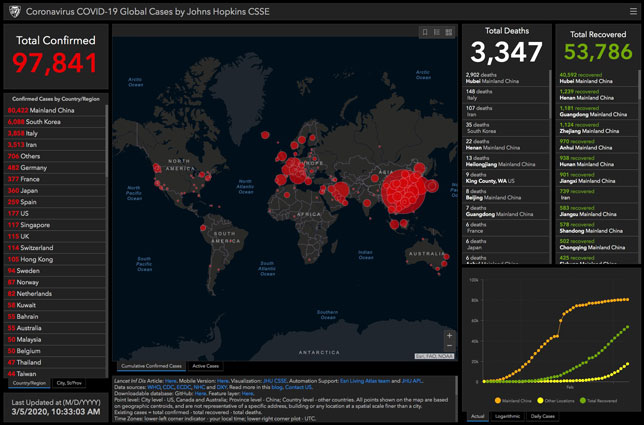
Coronavirus dashboard

Screen capture of the dashboard as of March 5, 2020

The Center for Systems Science and Engineering at Johns Hopkins University has developed an interactive, web-based dashboard that tracks the status of COVID-19 around the world. The resource provides a visualization of the "location and number of confirmed COVID-19 cases, deaths and recoveries for all affected countries," according to a university blog post.

The primary data source for the tool is DXY, a Chinese platform that "aggregates local media and government reports to provide COVID-19 cumulative case totals in near real-time at the province level in China and country level otherwise," the post explained. Additional data comes from Twitter feeds, online news services and direct communication sent through the dashboard. Johns Hopkins then confirms the case numbers with regional and local health departments.

All data from the dashboard is also freely available in a GitHub repository.

About the Author

Rhea Kelly is editor in chief for Campus Technology, THE Journal, and Spaces4Learning. She can be reached at [email protected].

Featured

  • The AI Show

    Register for Free to Attend the World's Greatest Show for All Things AI in EDU

    The AI Show @ ASU+GSV, held April 5–7, 2025, at the San Diego Convention Center, is a free event designed to help educators, students, and parents navigate AI's role in education. Featuring hands-on workshops, AI-powered networking, live demos from 125+ EdTech exhibitors, and keynote speakers like Colin Kaepernick and Stevie Van Zandt, the event offers practical insights into AI-driven teaching, learning, and career opportunities. Attendees will gain actionable strategies to integrate AI into classrooms while exploring innovations that promote equity, accessibility, and student success.

  • illustrated university campus with modern buildings, glowing binary code streaming straight and dynamically from multiple directions, integrated into the architecture, surrounded by stylized trees, grass, and walkways

    3 Ways Institutions Can Become Data-Driven Organizations

    Faced with declining enrollments and changing demographics, colleges and universities must make use of data and analytics to better serve students.

  • NVIDIA DGX line

    NVIDIA Intros Personal AI Supercomputers

    NVIDIA has introduced a new lineup of AI-powered computing solutions designed to accelerate enterprise workloads.

  • digital network with glowing blue and red lines, featuring multiple red arrows shifting in different directions

    Report: Attackers Change Tactics as Ransomware Payoffs Decline

    Attackers are changing tactics as they collect less money from ransomware payoffs, according to a new report from Chainalysis, a blockchain analytics firm.