How to Make the Case for Strategic Investment in IT
The right data story can transform IT from a cost center to a driver of institutional goals. Here's how to make the most of benchmarking resources and formulate a narrative to help advance technology projects and lay the foundation for digital transformation in higher ed.
Budget limitations are the biggest barrier to digital transformation in higher education, according to Campus Technology's 2022 Digital Transformation Survey. One key to overcoming that hurdle: Using data to articulate the value of IT and benchmark with peer institutions. In a Q&A session at our recent Campus Technology Leadership Summit, Educause's Leah Lang outlined the resources available through the organization's Core Data Service and how to put together a data-rich argument for investment in IT projects. Lang currently serves as director of corporate engagement for Educause; in her prior role as director of decision support, she set the vision and course for Educause's suite of digital decision-support products and services that help higher ed IT leaders link their work to strategic goals. (The following has been edited for length and clarity.)
Campus Technology: Can you give an overview of what the Core Data Service is and how to get the most out of it?
Leah Lang: Fundamentally, Core Data Service is a diagnostic tool. It helps IT decision-makers get an understanding of realistic spending ranges and staffing ranges in comparison to peer institutions — and then dig a little bit deeper into the data to understand how and why peers might be spending in particular ways. In terms of getting the most out of it, I'd say take time to learn about why the data had been collected, how to use the data, how to access the benchmarks and how to speak knowledgeably about the results. This is hard to do even for busy professionals who are data savvy, and not everyone has time to do it. So we host these monthly QuickTalks, which are just open office hours. You come in, and we go around the room and ask everybody what their goal is for the meeting. And then usually we get into a little demo of the tool, but we can workshop any problem that you're having with data or try to craft a data story together with you. We try to be hands-on in doing this work, because we know it's challenging.
We host our data in what we call the Analytics Services Portal. If you happen to participate in our survey, which runs in the fall, you get access to benchmarking dashboards for spending and staffing and services. The first page just shows your institution's spending in comparison to the previous year, to help you understand a little bit about your budget. When you drill into the data a little bit more, we show you the key metrics that we have created from the survey. You can filter all of our metrics based on peer groups that you can create on your own: You can pull together institutions that are just like your own, and then filter the results based on the responses from just those institutions. A metrics table highlights areas where you might be out of range in comparison to your peers. And then further into the dashboard, it shows you at a metric-by-metric level what the median metric is for that area.
For example, a very popular metric we have is central IT operating expenditures per institutional FTE. By drilling down into the tool, you can see a scatterplot of where you sit among the data for each institution in your peer group. There are different colors of data points to show institutions that were able to accurately provide data versus those that were just sort of guessing. So you can customize your experience by really getting a firm grasp on accurate estimates, or if you just need lots of data to get an idea of what you're spending, you can include all the data points.
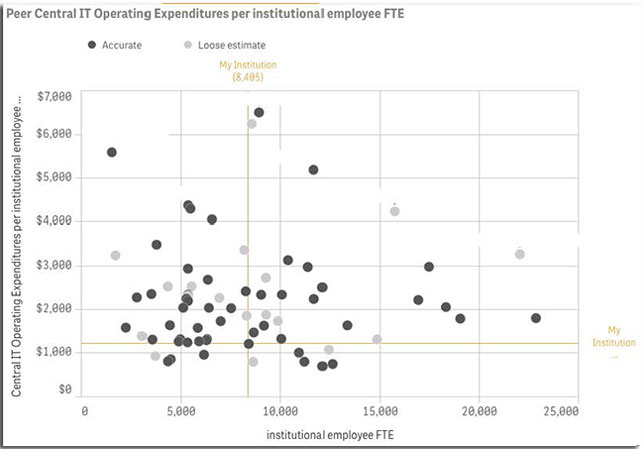
A scatterplot from Educause's Analytics Services Portal
CT: Is that self-reported, where people say, "Okay, this is definitely an accurate number versus a loose estimate"?
Lang: Yeah. We run the survey every year, and everybody does their best effort digging into their financials and their staffing. And sometimes institutions just can't provide a very accurate estimate, so we ask them to flag that for us. You can always go back into the dataset and revise your estimate — maybe you didn't have time during a particular year, and you want to take time later and give us an accurate estimate.
CT: What types of data should institutions be analyzing when they're benchmarking with peers or thinking about funding their IT efforts?
Lang: You should be analyzing metrics that are based on whatever research question you have. Whatever problem you're trying to solve, the metrics should align to that problem. There are some typical operational metrics that are good to demonstrate health of an IT organization. But really, you want to think about why you want to gather the metric, and then figure out what data supports that. The most popular metrics that we get asked for, we've summarized in what we call an Interactive Almanac. And that shows you an overview of typical metrics and gives you a public comparison based on high-level groupings of institutions. So doctoral institutions, master's institutions, you can get a feel for the benchmark range for an institution like yours. Generally, IT spending per student or percent of institutional budget spent on IT are the most commonly requested metrics. And that really helps for you to understand what resources you could have available to you, especially if you pick a peer group that only includes institutions that are like yours.
CT: Can you share any examples of how an institution has used data from the Core Data Service to make the case for budget dollars?
Lang: I've been doing this for a long time, so there are lots of use cases to pick from. Three that always have stood out to me:
One CIO I've worked with in the past did a really great job of digging into not just current-year data but historic data, and pulled out spending over time for his institution as compared to very similar institutions. The spend for his institution was pretty flat over several years, and the peer spending had grown quite a bit. We always hear this feeling of, "We're trying to do more with less." And a lot of people have a hard time demonstrating that with an actual visual. But what he did with this graph was overlay all of the extra commitments that had been requested of him over that same time period. The flat spend with the increased growth of expectations, in comparison to the increased growth of spending of peer institutions, drove home his point for why the budget was just unreasonable, and really helped to make the case for additional spending.
Another CIO uses the data regularly to come up with this metric called "efficiency of spend." And you can do this with the ratios that we provide naturally through our portal environment, with the percent of institutional budget spent on IT and those kinds of things. This efficiency of spend metric, to him, really demonstrates that if we're spending at this level, and other institutions that are much, much, much larger than us are spending at this level, we're actually operating at the efficiency of a huge institution when we have very few people. So to him, this metric helps to prove that his IT organization knows how to stretch a dollar. They know how to be efficient, so that makes the case with the leadership that they can be trusted with financial resources. If you give them a certain amount of money, they're going to spend it wisely and they're going to make really strategic investments. And so he's been really effective in those arguments.
And then my third use case, which I love, is something that can easily be done if your institution is a part of a system. It's really hard to understand efficiencies of spending across a system — especially duplication of services and whether or not things are subsidized. So if you can get all of the campuses in your system to participate in the Core Data Service, you can create a peer group of just the campuses in the system, and then compare spending from campus to campus. And you can use the ratios of spend per student or spend per budget to compare at a normalized level across campuses, to understand which campuses might be over- or under-spending or over- or under-utilized.
CT: Do you have any tips for putting together a data-rich argument to help get buy-in for a particular project?
Lang: I've taught classes over the years in data storytelling — emphasis on the storytelling. The data needs to take a backseat until you really know what you're trying to tell and why. Actually, before digging into a research question, I would advise to really hone your data literacy skills. That is a saw you need to sharpen all the time: You need to feel comfortable speaking about data naturally; you need to familiarize yourself with the data resources you have available to you. When you're speaking about those data resources, you need to be the expert — because your audience is going to have questions about the data, and you're not going to want to be caught on the spot without an answer to that question. This is a skill set you build over time, and Educause is so invested in helping the community build this skill set that we created a Data Literacy Institute last year. In a recent workforce study, we found that analyzing data to inform strategic decisions was one of the most important development activities for professional growth in our community. And so we're really investing in that through this Data Literacy Institute.
When you're preparing for a specific story or presentation, the story is separate from analyzing the data. I sometimes joke, "If you start with the data, you're doing it wrong." You want to think about: What's the background on why you're telling the story? What are your intended outcomes? Who are you telling the story to? What is their familiarity with data and how comfortable are they going to be if you throw a bunch of statistics at them? This is kind of like a storyboarding exercise. If you Google something like "Pixar pitch," there are lots of templates out there to help you with a framework for developing a story like this.
Once you do that pre-work, then you can dig into the data with your research questions and start to look at some stats that might be relevant. This is such an iterative process: I like to say that the data are not going to give you answers, they're going to help you ask better questions. So as you dig into the data, you ask more questions, you uncover more unknowns, document those unknowns, and put them into your presentation. I believe that transparency cultivates trust. And if you can be honest with your audience about the limitations of the statistics you're presenting, they're going to feel more comfortable with the experience, and not feel like you're trying to pull one over on them or that they don't understand what you're trying to talk about.
When you have all that data and the limitations documented, and you have your story put together, go back to the storyboard and just sprinkle in those data points. The data points should be thought of as those really nice pieces of salt in a chocolate chip cookie that add flavor. They're not going to be the whole cookie; they're not going to be your whole story. They're just going to add to your argument. So when we think about creating a data-rich argument, de-emphasize the data. You really need a strong story to start with that has data elements within it.
CT: Could you walk through the process of getting involved in sharing data with the Core Data Service and accessing those benchmarking tools?
Lang: We open the survey from the middle of September to early December. We actually publish the survey questions over the summer so that you can prepare for the survey experience. An early thing to do is identify a person on your campus, or in your IT department, who can speak knowledgeably about the IT budget or the staffing. Sometimes this isn't a person within IT; sometimes this is a person in your financial department or in your HR department. You want to get those resources in place early on and give them a heads up about what the survey questions are and how to answer them. As soon as you go in and answer the questions, you get access to the system of benchmarks from the previous year. And then typically, we release the new benchmarks at the beginning of the year in January. So it's a pretty easy process, except that it takes a little bit to dig into your financials.
CT: In those QuickTalks that you do to field questions about the CDS, what are the most common questions people have?
Lang: One thing that we often hear is: "I'm seeing this in the data. Why do you think that is?" And you know what? Honestly, sometimes I just don't know. It's survey data, and it's dirty. We have to dig into it and think about it. That's a really great use case for the QuickTalks, because we can think together. I also like to talk about this "data buddy" concept: When you're working with data, you need someone to bounce ideas off of, to discuss what you're seeing in the data and why, and get somebody else's opinion about what they might be seeing.
CT: Do you have a sense of the pandemic's impact on IT spending? Is that something that is visible in the data?
Lang: It's a little tricky to tell exactly what's going on. Some campuses are spending more; some are spending less. Right when the pandemic happened, I think it was very obvious to everyone that investing in IT was critical. We did see an increase in spending, and lots of campuses were fortunate enough to get some supplemental funding for that. And it's interesting, because they're not quite sure where to put that in our survey — does that count as one-time spending or operating spending or what — but we did see an influx of investment in technology. We're hoping to see that continue, because now, I think one of the things that came out of the pandemic is a realization that all of these latent infrastructure projects that we were just hoping wouldn't cause us too much trouble — when you layer new technology onto old infrastructure, it just doesn't work. So we've seen campuses needing to go back and make those really fundamental, core strategic investments in technology.
CT: That's something that came up in the analysis of our Digital Transformation Survey: how infrastructure enables all of the other aspects of digital transformation. If you don't have those core systems in place, it's not really possible to move forward with all the other things.
Lang: And that's a tricky argument to make, to spend that money on infrastructure. I renovated my house 10 years ago, and you know, half the money goes into the roof and the plumbing and the electricity — it's not fun to spend on things that aren't furniture and paint and stuff. Hopefully, the situation just demonstrates that infrastructure is necessary, and those things can be focused on now.
CT: Are there any changes or new CDS features on the horizon that you're working on?
Lang: The Core Data Service used to be a huge survey with like 150 questions, and it was like doing your taxes every single year — it was so complicated. We realized that with the pandemic, everything needed to be much more agile. So we took a look at the portfolio and really rationalized what the use case was for each question in the survey, and then tried to break out the survey into different services that support those different use cases. What you'll see now is that we have a very small survey about IT finances and staffing, and then we have a different opportunity for you to provide characteristics about your institution to support our peer grouping. We have 40 different institutional characteristics that we keep on file for every school. And you can go into our peer grouping system and identify, based on lots of really detailed characteristics, which schools are most like your own.
The other thing that I'm super excited about is what we're calling internally the Technology and Solutions Hub. For every institution, we're keeping on file what types of information system solutions they are using on their campus. What's your CRM? What's your student information system? What's your LMS? We plan to expand this into lots of different technology areas — advising technologies, information security technologies, communications infrastructure technologies. Those data points don't change very often from year to year, so it's silly for us to ask those questions in the survey every year. We're going to keep that on file for every institution, and whenever you get a new technology or change suppliers, you can update it. It gives you access to this great system that will show you what every other school is using in terms of technologies, when their technology was implemented, if they're planning to replace that system. And then you can even use that information to identify institutions you want to talk to — maybe you're doing a new implementation, and you want to talk to a campus that has been there recently. You can find that campus in the system, and get a head start on that conversation.
About the Author
Rhea Kelly is editor in chief for Campus Technology, THE Journal, and Spaces4Learning. She can be reached at [email protected].