2015 Salary Survey
Campus Technology 2015 Salary Survey: IT Pay
The numbers are in: Our survey of higher education IT professionals gathered salary data for hundreds of tech leaders and staffers in colleges and universities across the country.
- By David Nagel, Dian Schaffhauser
- 11/03/15
As readers we've always approached salary surveys with conflicting sensations — trepidation that we might be wildly underpaid; and hope that, if we're not, there's still room for growth in salary so that if we chose to leave the jobs we had, we wouldn't be priced out of the market.
If you're the same way, let's get the jolt over with quickly: The average salary of respondents to Campus Technology's IT salary survey was $75,621 (plenty of additional details to follow). People are generally positive in their outlook and don't plan to switch jobs anytime soon. Most do not expect promotions in the near future, and just a few foresee any kind of raise over the next year.
Average Salaries
For those working at a public institution, the average salary in IT is $74,021. The median (that spot that falls at the midpoint for the highest and lowest salaries) is $66,000. For those in a private not-for-profit, the average IT salary is $75,771. The median there is $70,000. The weighted average of those two is $75,621. (However, those numbers are only part of the story. Keep reading to find additional salary breakdowns by area of responsibility and job title. And if you work in the private for-profit sector, you'll find information about that in its own section later in this report.)
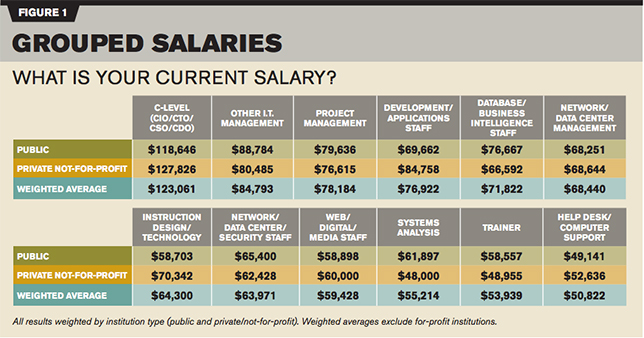
On the high end of salaries are those with chief-level titles — CIO, CTO, CSO and the like. The weighted average for C-levels is $123,061. The very highest salaries reported tended to be those earned by individuals who specifically possessed the CIO title and more particularly those who work in a private not-for-profit rather than a public institution. The average CIO salary for the first type of institution was $139,054; the average CIO salary for those in the second type was $121,333.
The "director of IT" title also gave respondents an edge in salary, particularly at public universities, where that position drew an average salary of $105,090. At private, not-for-profits, the average dipped to $86,391. The weighted average between those two was $96,098.
On the opposite side of the salary spectrum, the help desk and computer support people tend to earn the lowest salaries. For that job classification, the weighted average salary was $50,822.
If your job responsibility falls mainly in between one of those two extremes, check the "Individual Salaries" table below for the closest equivalent of your job title.
Experience and Job Duration
While seven in 10 people (72 percent) have worked in IT for 11 years or longer, according to our survey, a slight majority (54 percent) have switched institutions during that time. The numbers are fairly similar for respondents across both public institutions and private not-for-profit schools.
Prospects for Growth
People who work in private not-for-profit schools are the ones most optimistic about their prospects for getting a pay raise over the next year. More than six in 10 of those respondents (61 percent) said they do anticipate a raise. That count was only 45 percent at public institutions.
Far fewer individuals reported they expect to be promoted over the next year. Only 11 percent of those in public institutions said they anticipate that happening. It's even lower for private-not-for-profits; there the count is just under 10 percent.
Hunting for Greener Pastures
"So many jobs, so few applicants." That's the text from a Robert Half Technology report that examines 2016 job trends in IT. Many indicators (and lots of headlines) suggest that experienced technology professionals are at a premium right now. So it shouldn't surprise us that so many respondents in the Campus Technology survey reported that they expect to leave their current employers in the coming year. Nearly a quarter (24 percent) of IT people at private not-for-profits said they don't expect to stick around. A solid 20 percent at public institutions said the same.
That still leaves plenty of people who plan to stay with their organizations. In times of turmoil (a watchword, after all, for the field of technology) there's something to be said for constancy.
For Those Working in For-Profit Schools
Even though private for-profit schools make up nearly half of all institutions of higher education within the United States, they represented a small fraction of the total number of respondents to our salary survey. In order not to skew the overall results, we separated out those responses here in order to provide some level of information for readers who work in the for-profit sector.
A biggie is this: If you work at a private for-profit, the average salary is $76,370. (The number of responses was too low to provide a more meaningful set of salary breakdowns.)
Those in private for-profit institutions tend to have less experience in IT than those in public and private not-for-profit organizations. Whereas 72 percent of people in the latter have at least 11 or more years of IT experience, the proportion of experienced employees is considerably lower (49 percent) among those in for-profits. Staff also tend to have served less time in their current institutions. Whereas seven in 10 people (71 percent) at public and private not-for-profits have been on the job at their current institutions for six or more years, the count is only five in 10 (51 percent) at for-profits.
While 61 percent of IT people at private not-for-profits predicted a raise in the coming year, that data point was only 49 percent at private for-profits, only slightly higher than the 45 percent of respondents in public colleges or universities who anticipate a bump in pay. However, more people in the for-profit segment — nearly 19 percent — expect a promotion in the coming year than those who work at the other two types of institutions. Yet, about as many individuals also anticipate hunting for new jobs in the coming year; 21 percent of respondents from for-profits reported that they expect to leave their current employer over the next 12 months.
People working in the private for-profit segment were the most optimistic for the future. More than twice as many respondents (16 percent) predicted "unbridled growth and opportunity" for IT in higher ed than those who work in public institutions or private not-for-profits (7 percent).
Methodology
Campus Technology polled its readership in August and September of 2015. We put out an open invitation to IT professionals in higher education, incented them to participate with a $500 Amazon gift card as a prize for one randomly selected winner, and promised confidentiality for respondents. The survey was advertised on campustechnology.com and in newsletters, as well as in e-mail promotions to our subscriber list, with recipients asked to encourage colleagues to participate as well.
We received 818 completed surveys. Responses were manually culled that were clearly false or inappropriate for the survey. (For example, several K-12 IT staffers responded to the poll; their answers were excluded, as were responses from faculty members and non-IT staff and administrators. Those who responded with patently unrealistic salaries — which ranged from salaries as low as three digits to those beyond the highest-paid IT salaries on record for the United States — were also eliminated.
The final tally for qualified respondents was 613, of which 383 were from public colleges and universities (258 four-year, 89 two-year, the remainder graduate schools or other types of public institutions); 187 were from private, not-for-profit colleges and universities (154 four-year, six two-year, the remainder other); and just 43 were from for-profit post-secondary institutions. Owing to the relatively low turnout of for-profits, those responses were excluded from weighted results.
The remaining public and nonprofit institutions were weighted by institution type to be representative of the nation as a whole based on data from the United States Department of Education.
We also asked for, but did not weigh against, geographic location and size of the institution's student body.
Geographically, our respondents tracked very closely with ED's regional data for post-secondary institutions. New England: 6.77 percent; Mid East: 16 percent; Great Lakes: 17.16 percent; Plains: 10.07 percent; Southeast: 20.96 percent; Southwest: 11.06 percent; Rocky Mountains: 3.3 percent; and Far West: 14.69 percent. (For geographic breakdown, we used regions as defined in NCES' 2013-2014 IPEDS report.)
Owing to the large volume of responses from public institutions and dearth of for-profit institutions, student body size among our participants tended to be on the larger side than would be representative of the nation as a whole. The breakdown in student body size was: 0-499: 5.22 percent; 500-999: 3.26 percent; 1,000-2,499: 11.42 percent; 2,500-4,999: 13.21 percent; 5,000-9,999: 17.29 percent; 10,000-19,999: 16.8 percent; 20,000-29,999: 11.26 percent; and 30,000 or higher: 21.53 percent. There was no clear relationship between institution size and average salaries. Across the board, unweighted salaries tended to fall in the mid-$70,000s, except for the smallest institutions ($61,749), those in the 1,000-2,499 range ($67,170) and those in the 20,000-29,999 range ($79,608). The five remaining categories fell between $74,752 and $77,776.
The survey consisted of 14 questions, 13 of which were mandatory. A final open-ended question asking for additional comments was optional, though more than one-quarter of the qualified respondents chose to add their two cents.

