Thinking Beyond Project Completion: Analytics, Online Course Guides, and Quality Assurance
At the American Public University System, creating an online library course guide for every course the university offers (now numbering over 1,800) is just a first step. It's the application of metrics and data analysis for a higher level of quality assurance that will sustain the program into the future.
- By Raymond Uzwyshyn
- 02/20/13
In implementing any digital library project, there is a
required gathering of project metrics and numbers with regards to timelines and
quantitative project assessment. Many metrics from online digital library
projects also later find their way into university quarterly and annual reports
to demonstrate project progress and report back to senior leadership. Such
metrics are currently gathered for the American Public University System
libraries' Online Library Course Guides project.
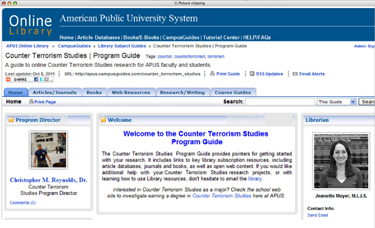
An APUS Online Library Course Guide |
The online course guides project is an award-winning
academic technology initiative to match every one of APUS's online courses with
an online library course guide, a new approach to offset the high cost of
traditional print text books. Now that the project has successfully completed
guides for a little over half of the university's course offerings, further
practical metrics may be applied to the initial statistical analytic framework
to widen the project's focus from course guide completion rates to higher
levels of quality assurance and sustainability.
Current Metrics and Project Successes
In the past year, the guides have produced massive savings in online textbook
conversion costs for APUS. The project has also been recognized with several
academic technology innovation awards, including a gold medal for the IMS Global Learning
Consortium's 2012 Learning Impact competition.
As a project of the library, the online course guide project has relied largely on librarian
completion rates to gauge progress. A quarterly and yearly scorecard is
developed listing the twenty online librarians' guide completion rates. Current library team member expectations
are for one to two course guides per month to be completed. This includes the
assigned subject librarian working with faculty, creating a draft and final
published course guide revisions. From the overall yearly and quarterly
scorecards, a list is developed as to who has met or exceeded prescribed
numbers and who has fallen below project expectations. This allows for
management to proactively oversee project sections that have fallen behind.
From the yearly group averages, new quota course guide production expectations
are set.
To address quality standards,
checklists have been developed to monitor guide production. This includes
features and functions considered standard for the guides. Another checklist
provides wider assurances that a higher level of interaction with associated
faculty members has been achieved, more optional preferable features (i.e.,
inclusion of digital media, open source quality links) are included, and
alignment with course objectives are met.
As can be seen in the bar chart below, the year-over-year student usage of the guides has been
logarithmic. While the rapidly increasing numbers of hits show a certain
implementation success as well as student acceptance and popularity, the numbers
also reflect quantitative metrics with their own limitations for assessing guide quality.
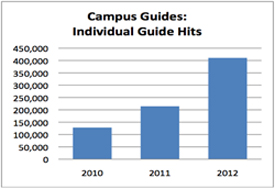
APUS 2010-1012 guide usage |
Future Metrics for Higher Levels of Quality Assurance
As we approach future analytics for
quality assurance, there are several metrics that are under development or have
been deemed potentially beneficial. One such metric would be derived from quantifying
student focus group data to gauge how constituents feel regarding the online
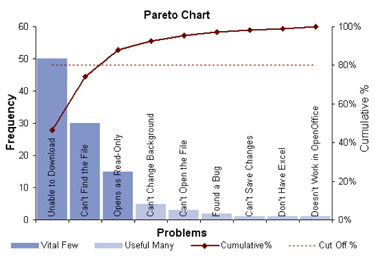
guides' various curricular parameters. From the student usability studies,
Pareto charts may be developed to identify features students prefer and also
prioritize problem areas through a histogram and frequency of occurrences table. Pareto charts are useful to display and arrange data so that the few vital features or factors that are most wanted or alternatively causing most of the problems may be easily found and changed as necessary. In the example below, we can see
that the most focus needs to be placed on technical download assurance and link
checking mechanisms.
Pareto chart usability example |
This is excellent information to glean as it shows implementation groups where to focus major efforts. As the amount of online course guides already created at APUS has become quite large (currently around 900), statistical
sampling is also useful to measure quality by choosing part of the larger
population. This may be done by school, program, or level (bachelors, masters,
certificate) to gauge quality, completion rate metrics, and gain better ideas
with regards to project progress or further areas to recommend for managerial
intervention.
Currently, the APUS libraries online course guide
project has been very well received by students, faculty, and wider
industry recognition. Continuing to manage the quality metrics of the guides and place a higher level of attention on project quality and metrics will hopefully
result in longer term sustainability of the wider project. Better understanding
of student expectations and needs through quantification of focus group data
and later Pareto analysis will also set the curricular guides on course as a
continuing example of best practice excellence in the field.
About the Author
Raymond Uzwyshyn is Director of Libraries for the American Public University System.