Masters of All They Survey
A web-based survey tool is helping IT shops monitor their performance on campus--and gauge the expectations and desires of their constituents.
Imagine playing Family Feud where all the survey questions are about what campus constituents think about IT: "How important is it to you that faculty use technology to enhance the learning experience?" or "How important is it for you to be able to access the campus internet service via your tablet or mobile?"
Like the contestants on the show, many IT shops would be left guessing at the answers their constituents would give. And that doesn't bode well for their ability to develop long-term strategies or improve their effectiveness. A survey tool, known as TechQual+, aims to fix that, giving IT leaders a quick and easy way to gauge their departments' performance on campus and learn what matters to their constituents, including faculty, students, and staff.
The idea of an IT survey tool that can be used across higher education has its skeptics, who feel that colleges and universities are too varied to be able to benefit from a single survey tool. But Timothy Chester, CIO at the University of Georgia, believed it could be done and he had evidence: The creators of LibQUAL+, a library services survey tool, faced similar arguments when they initiated their project, yet that project was succeeding. In 2006, Chester, who was then at Pepperdine University (CA), set out to create a counterpart that would measure the effectiveness of IT departments, no matter the type or size of the institution.
The resulting survey instrument is a deceptively elegant solution to the IT survey problem. And schools that use it are reporting an increased ability to monitor the success of their IT programs, plan strategically, and make funding requests more persuasive.
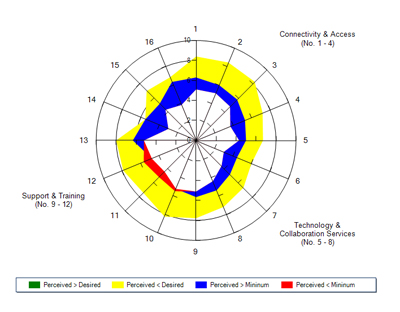
TechQual+’s radar-style chart provides a visual demonstration of how well the perception of services measures up to the desired levels. |
TechQual+ consists of 13 core questions. Schools can customize the survey and add multiple-choice, multiple-answer, and open-ended questions. Web-based tools make it easy for schools to create, administer, and brand the surveys, as well as to analyze the response data. Importantly, schools can then compare their results with peer organizations. The surveys themselves are hosted on TechQual+'s enterprise-grade infrastructure.
When Chester began work on the survey, he discovered that faculty, students, and staff all want pretty much the same IT services, regardless of whether they're at a large institution, a small liberal arts college, or a regional teaching college. "The stories we heard were along three themes," he recalls. "They wanted consistent internet access and wide availability of wireless access. They wanted access to web-based services and tools that improve collaboration among faculty, students, and staff. And they wanted good support, as well as training for the schools' tools and services."
The survey is divided into three sections that reflect these themes. For each question, respondents rate their minimum level of acceptable service, their desired level of service, and their perception of the current performance of that service. Respondents can also choose to elaborate on each question in an open-ended comment section.
To help administrators analyze the results, the data includes information about the survey population and zones of tolerance--the ranges between respondents' minimum expectations and desired service levels. Data is also presented in the form of a radar chart, which looks a like a dartboard with yellow, red, green, and blue paint splotches (see graphic). The radar chart provides a visual demonstration of how well the perception of services measures up to the desired levels.
"The radar map can be a little confusing at first, because it's a little more complicated," says Thomas Hoover, associate vice chancellor and CIO at the University of Tennessee at Chattanooga (UTC), who first encountered TechQual+ when he worked with Chester at Pepperdine. "But it shows a scale of expectations, which gives you a more realistic answer. Otherwise, it's not clear if you're comparing your access to the access in your home, the airport, Starbucks--what have you. We need to know this."
Acting on the Data
At Pepperdine, the IT department uses the TechQual+ survey data extensively to analyze its IT program and make recommendations to the school's Leadership Council. "That way, we can set priorities and budget for the next fiscal year," says Jonathan See, Pepperdine's CIO.
A few recent projects at Pepperdine, including one to create more smart classrooms on campus, originated from TechQual+ survey results. The goal of the smart classroom project, says See, was to enable the School of Public Policy to connect with the Washington, DC, campus, so students could engage with speakers, including members of Congress, using A/V projection and conferencing software.
Pepperdine's IT group has also been working with various deans to set up technology-training workshops for faculty. "Faculty development is a key initiative," See says. "This need is something that TechQual+ showed us, and our experience working with faculty confirmed it."
Monty Wilson, assistant vice chancellor and CTO at UTC, also attributes several recent IT gains to results garnered from TechQual+ surveys, including the extension of wireless coverage to student housing.
"Students wanted it, IT wanted it," explains Wilson. "Collecting data from students helped to give some very specific, focused data to the administration, so they could understand its importance and provide the funding for it." By this fall, UTC student housing will have 100 percent wireless coverage.
UTC also used TechQual+ data to direct stimulus funding toward the replacement of old computers. "At the same time, it also highlighted the need for us to have a sustainable funded program to refresh computers," adds Wilson. The vice chancellor for finance and operations has now made this program a priority.
One of the aspects that Hoover likes most about the surveys is the ability for respondents to add their own comments, noting that they are invaluable during funding requests. "If you have a direct quote from a student that you can give to an executive, that's golden," he says.
Indeed, during these days of diminished resources, Hoover thinks TechQual+ data gives IT a leg up on other departments: "The data allows us to sit down with an executive and say, 'Here are the needs, here are the direct quotes, and here's how that's trended over the last couple of years.' Other departments don't have that."
The ability to use the survey data to zero in on specific problems has certainly paid off at Pepperdine. When some survey participants reported that the wireless service in the dorms was bad, for example, See's department was able to pinpoint the exact building with the problem, based on identifying data provided voluntarily by the students.
Tracy Schroeder, vice president for information services and technology at Boston University (MA), turned to TechQual+ in July 2009 when she first joined the school and "needed to get a relatively quick indication of how IT was doing." One of the benefits of TechQual+, says Schroeder, is that "it's a best practice for higher education. It was created by higher education for higher education."
After three years, Schroeder recognizes that TechQual+ does have some limitations--it's not a crystal ball by any means--but she believes the tool will only get stronger as more institutions implement it and begin to compare their performance. "My hope is that more institutions will adopt TechQual+ so that it will enable us to measure the impact of investments, so that we can do more complete benchmarking," says Schroeder.
In the last year, the number of people taking the survey across institutions has increased 64 percent, from around 70,000 respondents to 115,000. Survey says...Schroeder might get her wish.
About the Author
Michelle Fredette is a freelance writer who splits her time between Portland, OR, and Seattle.