Carnegie Mellon Maps Offer More Data for COVID-19 Forecasting
Carnegie Mellon University has created five interactive maps intended to paint a more detailed picture of COVID-19 across the country and help in forecasting disease activity. The COVIDcast maps bring together real-time data on symptoms, doctor visits, medical tests and browser searches related to COVID-19, offering some unique insights into what's happening at the state, metropolitan area and county level.
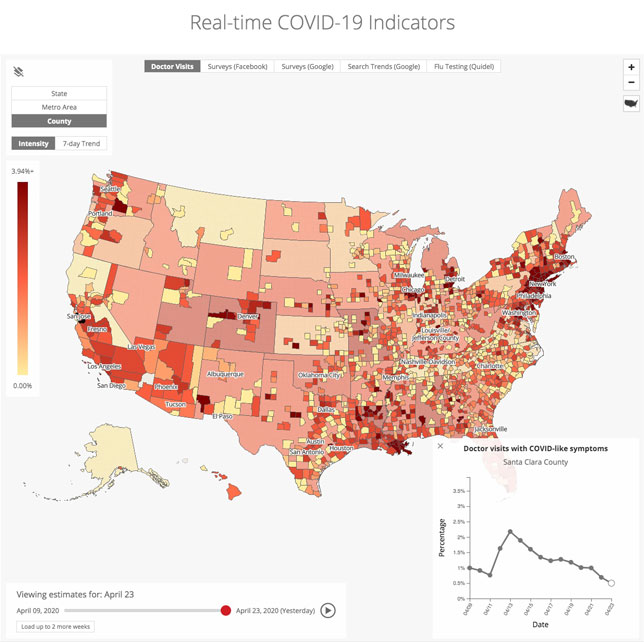
Screenshot of CMU's COVIDcast as of April 24, 2020
For example, a national health system is providing statistics on patient visits to doctors and telemedicine visits, allowing CMU researchers to estimate how many patients in a given location are seeking medical attention for COVID-19 symptoms. Similarly, data from Google Health Trends provides an estimate of how often people are searching Google for topics related to COVID-19. And medical test maker Quidel is providing statistics on influenza tests, which are routinely ordered for people suffering COVID-19 symptoms in order to exclude flu as a diagnosis (and therefore can be indicators of possible COVID-19 activity), the university explained in a news announcement.
The researchers are also pulling data from Facebook and Google surveys asking people if they know anyone who is experiencing COVID-19 symptoms such as fever, cough, shortness of breath or difficulty breathing. Self-reported symptoms help CMU make estimates of disease activity, which the researchers have shown "are strongly correlated with test-confirmed cases of COVID-19," the university said.
"All of these signals are just rough indicators of COVID-19," noted Roni Rosenfeld, co-leader of CMU's Delphi Research Group and head of the university's Machine Learning Department, in a statement. "Any one data source may not be conclusive, but if multiple sources indicate the same thing, people can have greater confidence about what is happening or will soon happen in various locales."
COVIDcast was created by Carnegie Mellon's Delphi Research Group and COVID-19 Response Team, which includes a number of volunteer faculty, students and staff. The researchers expect to add more data sources over time; all Delphi estimates are available via a GitHub open API.
"COVIDcast leverages Carnegie Mellon's leadership in machine learning, statistics and data science, and builds upon our partnership with the Centers for Disease Control and Prevention in epidemic forecasting at a time when policymakers and healthcare providers are eager for more insights into the spread of COVID-19," commented CMU President Farnam Jahanian. "Our multidisciplinary team of researchers has worked tirelessly to bring together a variety of data sources to support informed decision-making throughout our global society."
About the Author
Rhea Kelly is editor in chief for Campus Technology, THE Journal, and Spaces4Learning. She can be reached at [email protected].