How Data From Your LMS Can Impact Student Success
Higher ed IT leaders share 8 ways to make the best use of the data coming out of the campus learning management system.
- By Dian Schaffhauser
- 12/02/15
This fall, Oral Roberts University (OK) issued Fitbits to on-campus students and Garmin vivofits to online students — part of the "whole person" philosophy at the Tulsa-based institution that urges students to be "well prepared" physically. The data generated by those activity trackers on movement, heart rate and sleep patterns drizzles automatically into the university's D2L gradebook in time for settling up midterm grades and finals. The results are displayed through D2L for faculty and students, just as if they were weekly quiz grades. The Garmin device, added CIO Mike Mathews, syncs with an online service that allows students to set goals and share progress with others.
Eventually, the campus will use the analytics to find out whether tracking the fitness data and making it visible gets students to move their bodies more, which is the goal, after all.
A stand-alone wearable wouldn't be nearly as compelling to Oral Roberts U if it didn't also tie right into D2L's analytics product, Insights, which the university uses for data mining and reporting. "We're 100 percent leveraged on D2L," said Mathews. That means people log into D2L first to gain entry for every other application they use for learning and instruction — the LMS, digital textbooks, the e-portfolio. "Everything is centered around the universe of D2L."
That's the way a lot of the best analytics work in higher ed right now: Small streams of data pour into and out of the learning management system to tell administrators, teachers and students things that can make a difference in their decision-making. Here's how others are making the best use of analytics available within the LMS to influence student success.
Adopt a Tool That Anybody Can Use
When the University of Maryland, Baltimore County attempted to implement an early analytics effort in PeopleSoft, which had provided its administrative systems, the university struggled for a year and a half to wrangle analytics before it finally looked up and noticed what was happening about seven miles northeast of campus. Coppin State University had become an early customer of iStrategy, a company that developed data warehousing and business intelligence software for higher education.
"We brought that product in, and we realized that it ran circles around what we were doing with the technology that we had bought from PeopleSoft," recalled Jack Suess, CIO and vice president of IT. The university built a "robust reporting and analytics environment" to answer real-time questions, and the heads of enrollment management and institutional research began carrying laptops to meetings just so they could answer questions on the fly.
Compare that to the previous scenario: A question would be posed and submitted to Institutional Research, and two weeks later a response would come back. Then a meeting would be scheduled. Four weeks later the meeting would convene, the answer would be given and inevitably somebody would raise a hand to ask a follow-on question. And the painful cycle would start again.
UMBC quickly directed its new analytics capabilities to the area of student success — which involved Blackboard, the campus LMS. And when Blackboard acquired iStrategy in early 2011, all the better, as far as UMBC was concerned. Now the technology serves up the "gold standard" used by the institution in its official reporting to the federal Department of Education and the state Higher Education Commission.
More importantly, the IT organization has distributed the ability to use Blackboard Analytics on the student side "across all the colleges and all the key functional offices that are responsible for student success, so they're all able to get the kind of data that they want," said Suess. "I have nobody on my staff who writes custom reports for the departments. They're all able to do it directly through iStrategy."
Use Analytics to Identify Faculty Innovation
A decade ago, UMBC began asking: Does the use of Blackboard make a difference in student success? At that time, recalled Suess, none of the LMSes had reporting capabilities that would allow people to view student activity. So John Fritz, assistant VP of instructional technology & new media, and a grad student started coming up with ways to mine the LMS database to understand how faculty were using the application in order to obtain the information his administrators wanted.
In particular, they found a "crude measure" — average hits per student — that became a proxy for student engagement, which could be applied to any course in the LMS to compare grades with LMS usage. "Semester after semester since 2007, students who get a D or an F use Blackboard 39 percent less than students who get a C or higher," Fritz revealed. "It's the same every semester."
In the course of running the reports to support that observation, Fritz stumbled on something else: A handful of faculty members would "pop up" as doing innovative things in the classroom, highlighted by the number of hits their students were making to the LMS. So Fritz would reach out and talk to them about what they were trying. "It helped to find the needles in the haystack," he said. "Without having some sort of window into what was happening in the LMS, it would have been almost impossible to find these people who were experimenting and profile them to others on campus as potential exemplars."
That's how Fritz found Tim Hardy, an adjunct instructor teaching an accounting course required in several majors whose course LMS usage "was off the charts." Hardy had learned about a Blackboard feature called "adaptive release" that lets the faculty set preconditions a student has to meet in order to gain access to other course materials within the LMS. In his "highly replicable process," Fritz said, Hardy would require his students to read the chapter, watch a video for each learning objective and then pass a short quiz with a perfect score before they could proceed to the activities that gained them points toward their grade. His approach (shared online in this 2010 video starting at minute 28) had the best success rate in the department, and his students did 20 percent better on the final than any other cohort.
That kind of performance improvement impresses other faculty, Fritz offered. "If I can use the data to identify the effective practices and practitioners, I can shine a light on what they're doing."
Help People Refocus With the Facts
The analytics give UMBC a clear view of who's doing what in the LMS; but more importantly, the data helps Instructional Technology show faculty exactly what's being accessed in their courses by students — and to make sure, as Suess explained, their time is being invested in parts of the course that are "garnering more student engagement."
In the case of Hardy's course practice, his students initially "hated" his use of the gated access. But, noted Fritz, "What they couldn't argue with was the results that they were getting."
The same is true with faculty members. Pushing through resistance from students as well as one's own long-embedded instructional practices requires a "really brave faculty member," he said. "But if the data or the analytics show that these kinds of things work, well, now I think you're starting to change the culture."
Promote Student Ownership of Learning
Fritz classifies LMS usage in three tiers. In the most basic tier the LMS serves as a document repository. In the second tier faculty use it for communications, such as announcements, chat and discussions. But where it "really goes off the roof" is when the LMS is used for assessments — "quizzes, things like adaptive release, electronic collection of assignments." That "sets up a structure for student responsibility and self-awareness" that isn't typical, he noted. In talking about student success, "the conversation is almost always dominated by what an institution is doing for the student."
"Check My Activity" promotes student responsibility from a different angle. This self-service tool was launched by the university in 2008 to allow students to compare their activity in the LMS against that of other students. In the intervening years the school has shifted to the use of Blackboard Analytics for Learn, which now offers a similar feature. But all of it comes down to giving students feedback, observed Suess: "Hey, you're in college now. It's time to up the ante. You've got to go to a new level if you're going to compete with a lot of kids that are also really bright, like you are."
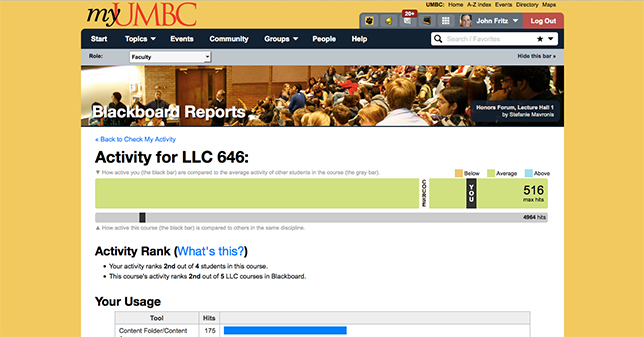
A self-service "Check My Activity" tool allows UMBC students to compare their activity in the LMS against that of other students.
Usage of the tool goes way up when faculty members also post grades in the grade center, "because now what [students] can see is how active they are compared to students who earned the same, higher or lower grade on any assignment," said Fritz.
Last year, the Blackboard version of "Check My Activity" was made available to faculty as well, so they can check on how active their courses are compared to their colleagues within the same department.
Leverage Analytics for Highest Impact
All of the various flows at UMBC eventually feed into one big problem: identifying the "20 or 30 courses that are impediments to student success and [concentrating] on pedagogical innovation around those," said Suess. "That's one of the key drivers to long-term institutional success — focusing on what's most critical to be getting your students through." That's the sweet spot where analytics and the LMS "begin to mesh," he suggested.
Each semester, the university scrutinizes its DFW rates. However, it's not a simple matter of simply tracking the courses where the counts of failure and withdrawal are high. It's also important to examine the outcomes students have as they go through gateway courses into other classes making up their majors. At UMBC, said Fritz, deans and faculty members are "data mining" the courses where there's a substantive difference in grades, "reverse engineering" the teaching practices, and then trying to embed those practices into other courses. "That's when you know it's starting to take root — when people follow their own curiosity trails and we just provide the infrastructure or the environment where they can do those kinds of things," he said.
Get Access to More Data
Utah State University, an early adopter of Instructure Canvas, was also a test pilot when the LMS company made its entire database available to a select group of customers earlier this year. Each night the data from USU's instance of Canvas is uploaded as snapshot to Amazon's Redshift cloud-based data warehouse.
Previously, the school had access only to what the company made available through APIs, which, suggested Kevin Reeve, director of the Teaching & Learning Technologies office in the department of Academic & Instructional Services, is "probably a very small subset if we were to compare it to the whole database."
Having access to four years' worth of accumulated LMS data "opens up some pretty incredible opportunities to capitalize on that data so that help is more proactive than it is reactive for a student," said Reeve. "We've got no end to questions we want to ask."
For example, an initial query looked for correlation between students watching videos for their courses and the grades they received. The initial results taken from a couple of classes are "inconclusive." In one of the courses, the videos were being viewed by students who ended up receiving lower grades. "At first it was like, wait a minute. It's not the A students watching the most videos — it's the C students." One possibility he mentioned is that viewing the videos is actually helping students pass a class that they might have otherwise failed. As he noted, "It's brought on more questions."
Make the Data Reachable
Currently, said Reeve, Utah State is working on a dashboard for faculty members based on their feedback about what they'd need to get an overall picture of how things are going in the course: how many students are turning in assignments either at the last minute or late, how many missed assignments. "You want to give a snapshot," he explained. "Then you can [let them] click and drill down deeper."
Reeve, who serves as an adjunct instructor for IT communications, believes that kind of basic reporting can be invaluable to make sure students don't get lost in a course. "I've had challenges," he acknowledged. "Students started missing a couple of assignments; then they got behind and they never got caught up, and I had to give them F's. I don't like giving students F's. Most faculty want to help students succeed."
Once the dashboard reporting is available, the next step will be automating outreach to send pre-written messages from the instructor to offer assistance when specific events — e.g., an assignment is skipped — occur. "That'll let the student know that people care, that the instructor is watching," Reeve asserted.
Continually Seek New Ways to Expand LMS Data Usage
Now that data is amply available, the university can track how students navigate their courses. "It's kind of fascinating," said Reeve. "We've got this incredible pathways graph. It's like nothing I've seen before. For example, we could go to the syllabus and [see] the pathway that students took to get to the syllabus and where they went next. We can see patterns in courses."
In fact, one faculty member is using that data to build his case for promotion and tenure. "He wants to make his course better and remove any ambiguity or trouble [spots] that students have where they can't find something," Reeve explained. "So he's using that data personally to improve his teaching and his course, which also helps with student retention."
And that, Reeve pointed out, is just how the biggest retailers now operate. "The buyers back at corporate headquarters know immediately when something has been bought. They can see live data about what's popular in their stores across the country so they can immediately buy more and not get surprised. Higher education needs to take advantage of data to do very similar things."