Finding the Data that Makes a Difference
Southern Connecticut State University has spent 10-plus years homing in on factors that really contribute to student success — and how best to help keep students on track.
- By Dian Schaffhauser
- 10/11/18
Category: Administration
Institution: Southern Connecticut State University
Project: Educational Intelligence: How One University Uses Data to Improve Student Outcomes
Project lead: Michael Ben-Avie, former director, Office of Assessment and Planning
Tech lineup: Digital Measures, IBM, Snap Surveys, Watermark

Southern Connecticut State University
More than a decade has passed since Southern Connecticut State University kicked off its first longitudinal cohort study in 2007. That effort was led by the institution's Office of Assessment and Planning. Its mandate: to promote a "data-driven process of educational change."
While the university's Institutional Research office works closely with Assessment and Planning and both groups contribute to maintaining the university's accreditation, the latter's collection and analysis of data is focused on identifying the "differences that make a difference."
And that requires data — some 1.9 million data points for the latest cohort data sets. The data collection begins with the basics: student profiles as they enter, including gender, ethnicity and hometown; SAT scores; whether students are athletes or registered with the disability resource center or honors college. From there it begins pouring in from multiple sources. During new-student orientation, Assessment and Planning administers two surveys, one on the impact of orientation and the other to baseline student engagement or their preparedness for college. Then there's the first-year experience survey given during the fall semester as well as other surveys on financial literacy, student satisfaction with services, satisfaction with admissions and enrollment for transfer students and plenty more. Plus, every semester students' GPAs are updated, grades are added, data on math proficiency is factored in, and scores from the Multi-State Collaborative to Advance Quality Student Learning are collected, along with standing on the dean's list and majors declared.

Michael Ben-Avie
Each student is tracked for at least seven years, including where they've gone if they've withdrawn from the institution before graduation — whether it's to a private in-state university, a community college, a college in some other part of the country or out of higher education altogether, according to Michael Ben-Avie, former head of the Office of Assessment and Planning (Ben-Avie is now senior director of learning assessment and research at Quinnipiac University).
The cohort data is uploaded to IBM's Watson Analytics, which suggests starting points for data analysis, such as "What drives retention." When a starting point is chosen by the user, Watson will produce a visualization with the most important predictors and give each one a "predictive strength." From there, the user can ask follow-up questions using natural language. Ben-Avie tells students in the school's Watson Analytics internship program, "You don't need to know statistics because Watson will pick the most appropriate statistical analysis to run. You don't need to code because it's natural language. What it does is get at broad strokes," he said. "Then I'll go to use SPSS and other statistical programs to probe and explore more in depth.
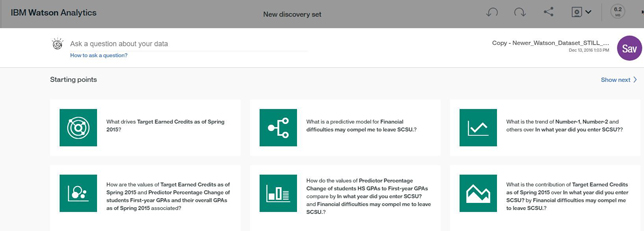
Watson's "starting points"
Armed with a data-derived understanding of what the university needs to pay attention to, the school engages in "campaigns," programs to address specific findings. For example, take a student who has expressed her intent to go into nursing, but has struggled with the prerequisite courses. The campaign might be, "You've always wanted to go into nursing, but [why don't you] explore other careers in health fields?" As Ben-Avie noted, "We don't have to say to the student why [she] received that particular communication. But we know the reason is because that student is not likely to be accepted into the program and we don't want that student to leave higher education."
Another campaign might target first-generation college students, who are, said Ben-Avie, "vulnerable in terms of withdrawal from higher education. They may not have the support of their families or their immediate environment." The university has created "living-learning" communities where students live in the dorm with residential staff members who were first-generation college students themselves. Students also attend courses with professors who were as well. "We don't say, 'The reason why we're [encouraging] you to [join] this living-learning community is because you're vulnerable,'" he emphasized. "We approach them and say, 'We have this really great opportunity and we think it'd be great for you and you would gain so much from it.'"
And Ben-Avie pointed out that the living-learning communities aren't a foregone recommendation for every first-generation student — just the ones for whom they're best suited. "There are nine different definitions for what a first-generation college student is," he said. For example, among the students who work in his office as interns (all of whom are first-generation), one has a mother who's an immigrant and a father who never attended college. Yet his older brother is also a student at the university. "Having an older sibling who attended college at all, even not here, that's a protective factor. Having a parent who attended some college but did not graduate, that's more of a protective factor than having a parent who didn't attend college at all."
His point is this: Traditional statistics have always forced analysis of large groups. "With cognitive analytics you're able to get to the individual student level. We're able to say that having an older sibling attending our university is a protective factor. We can get very nuanced here."
Besides IBM Watson and various statistical programs, Assessment and Planning has also come to rely on Watermark for centralized data collection, particularly for programs that have a credentialing aspect. "I'm very concerned about what I would call rogue data sets," Ben-Avie said. As he explained, users find university databases "too awkward to use," so they often keep records for themselves, usually in a spreadsheet or on paper in locked filing cabinets. None of that helps when the professional organizations accrediting the programs want to see evidence of competence.
By using Watermark, all of that data is brought together "in a safe, secure place," he noted. As students do field work or other projects related to their programs, faculty can handle evaluations digitally and pass them through the entire workflow, with feedback going into the student's own portfolio. When a student is required to write a final paper, for example, it can be uploaded into Watermark, graded by faculty members, and results fed back to the student. Behind the scenes, Assessment and Planning can pull the scores from all the students to identify patterns and anomalies. Also of particular help: Professional standards for the various programs can be mapped to learning rubrics and the scores can be auto-generated by the online assessment system for easy reporting when it's needed.
Other technologies in play include IBM SPSS for predictive modeling; Digital Measures Activity Insight for faculty annual activity reporting and as the system of record for faculty workload; and SNAP Surveys to administer paper and online surveys.
In 2013, the university became more tenacious with moving the needle on student success by forming a "student success taskforce." That group posed 19 compelling questions to Ben-Avie, generating several reports from Assessment and Planning, the first done within a month and the others within a few months. Those results led, he said, "to very major changes in how we do business." The advisement center was changed; an academic success center replaced the traditional structure for tutoring; a role for a financial literacy coordinator was created; changes were made to how the university approaches remedial math; and on and on.
A key to success for an initiative like this, Ben-Avie said, is "time and patience." Longitudinal cohort studies "are very complex. They have to be constantly maintained, constantly checked for accuracy. But here's the advantage: When the university has a question, there's no need to scramble to find the data," he noted.
More importantly, the emphasis on data has allowed the institution to shift its mindset to "that which is amenable to change" instead of focusing on student profiles, asserted Ben-Avie. "We can't change students' high school experiences. We can't change their demographic profiles. We can't change their parent income levels. We can't change their ethnicity. Looking at that which is amenable to change and demonstrating again and again that far more important than these unchangeable characteristics are the experiences they have on campus, relationships that we form with the students — [that] gives us a sense of empowerment that we can make a difference in these students' lives."
Return to Campus Technology Impact Awards Home
About the Author
Dian Schaffhauser is a former senior contributing editor for 1105 Media's education publications THE Journal, Campus Technology and Spaces4Learning.