Carnegie Mellon Tool Displays Visualization of Malware Attack Patterns
- By Dian Schaffhauser
- 11/14/16
A security research project at Carnegie Mellon University could simplify the process of identifying how malware is being distributed through visualization. Researchers at the institution's CyLab Security and Privacy Institute have created a tool that lets a network or security administrator display network traffic in a way that helps identify the changes and patterns The results could eventually help organizations stop the kind of distributed denial of service (DDoS) attack that brought down major websites in late October.
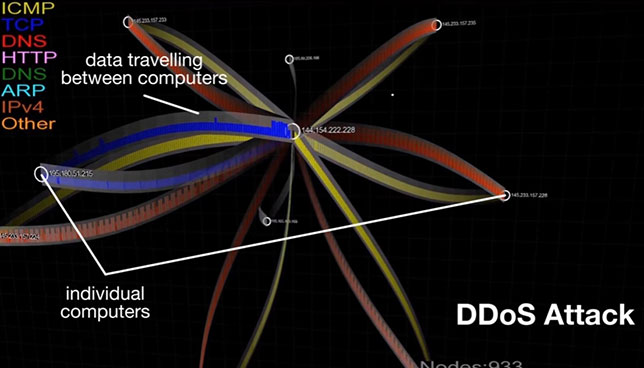
Traditionally, network traffic identification is handled through static reports that show little more than IP addresses and timestamps, making the identification of traffic patterns challenging. The tool, in contrast, generates a dynamically changing graph of a malware distribution network to show top-level-domain data collected from Google Safe Browsing reports across a given period. It was created by Yang Cai, senior systems scientist for CyLab, and Sebastian Peryt, first author on a paper about the project and a research assistant in CyLab.
As Cai explained in a video, "Visualization helps us connect to the dots so we can see the overall changes. We can see the malware propagation patterns over time and that's very important."
Based on those visualization graphs, "analysts can focus on critical areas to help shut down a malware distribution network, or in the case of a DDoS attack, target a critical node to thwart the attack," added Peryt, a research assistant in CyLab.
In the future the team hopes to make the tool more usable, taking into account human interface factors, and to integrate it into a virtual reality platform.
About the Author
Dian Schaffhauser is a former senior contributing editor for 1105 Media's education publications THE Journal, Campus Technology and Spaces4Learning.