Data Map Shows Computer Science, Business are the Most Popular Online Courses in the U.S.
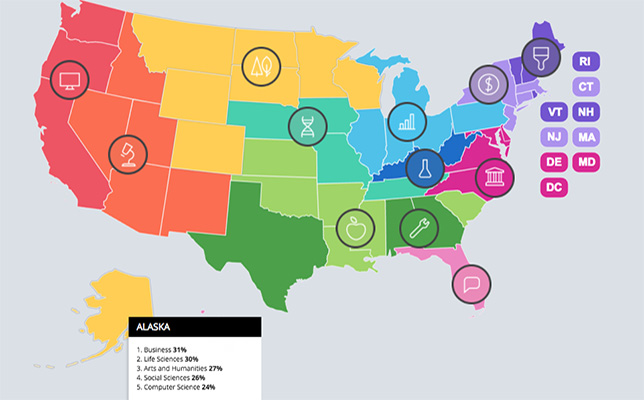
Image Source: Coursera Blog.
Coursera has analyzed data from 5 million students in the United States who have enrolled in the company’s massive open online courses (MOOCs), uncovering that computer science and business are the most popular topics overall in the majority of states.
“Previously, we’ve shared data on how topic interests vary by country,” wrote Kyle Shiells, a data scientist at Coursera, in a blog post announcement. “This time, we wanted to look more closely at course enrollments among the 5 million learners in our largest market: the United States. Just as job opportunities, age demographics and political views vary across states, we found that the subjects people study vary geographically, as well.”
Specifically, California and Washington were found to be the top two states in every subtopic within computer science. The former is ranked No. 1 and the latter is No. 2 for the following course topics: algorithms; computer security; design and product; machine learning; math and logic; mobile and web development; and software development. Notably, Alaska ranked No. 1 in engineering and physical science courses.
Not too surprisingly, Washington, D.C. has the most students enrolled in government-related topics (i.e., society, economics, law), followed by neighboring states Virginia and Maryland. Mississippi has the highest relative interested in education, with an emphasis on school subjects like history and chemistry, according to the blog post.
Coursera launched an interactive map displaying the data. Titled “United States of Knowledge,” the map assigns each state a color that corresponds to one of the following 12 “learning regions”:
- Red represents the “Tech Trail,” found on the West Coast, where tech courses on topics like web design and data analytics are trending;
- Orange is the “Bio Belt,” a western region where medicine and biology courses are most popular;
- Yellow is the “Environmental Range,” a large northern area where green energy policy and other environmental topics are of high-interest;
- Light Green represents the “Teacher’s Corner,” a southern region where education is trending;
- Green is the “Mechanical Quarter,” where topics like mechanical engineering and electrical engineering are the most popular;
- Teal represents the “Biotech Corridor,” a central U.S. region where biomedicine and genome sequencing courses reign;
- Light Blue is known as the “Business Basin,” where online learners show the most interest in business strategy, leadership and marketing;
- Blue represents the “Chemistry Zone,” located in two states where chemistry courses are most popular;
- Purple is the “Art Annex,” found in the northeastern tip of the country, where visual and liberal arts courses soar;
- Light Purple represents the “Finance Club,” an East Coast area where corporate finance and personal investment management courses dominate;
- Pink is “Dialect Alley,” two states where language and linguistics courses are taken at unparalleled rates ; and
- Hot Pink is “Federal Way,” an area found near the nation’s capital that has the most government courses being taken.
The map allows users to delve deeper into the data and see rankings for each individual state.
To learn more, view the “United States of Knowledge,” available here.
About the Author
Sri Ravipati is Web producer for THE Journal and Campus Technology. She can be reached at [email protected].