Students More Likely to Read Alerts that Deliver Good News and Comparisons with Peers
- By Dian Schaffhauser
- 07/26/17
Students love to hear good news about how well they're doing in their courses or how their performance — good or bad — compares to other students in the class, according to a research project undertaken by Blackboard's analytics and research team. The study examined anonymized data pulled from 3,679 students who received a total of 22,227 notifications in 414 courses at four institutions.
The goal of the study was to find out whether students viewed dashboards more for some notification types than other, and whether certain types of notifications were more effective for certain types of students.
Notifications used in the project adhered to four distinct rules:
- A GradeIncreased alert was sent when the student's grade increased 10 percent compared to the prior week;
- GradeDropped went out when the grade dropped by 10 percent compared to the previous week;
- GradeInHighest was sent when the grade appeared in the top 10 percent of students' grades; and
- GradeInLowest was delivered when the grade was in the bottom 5 percent of students' grades.
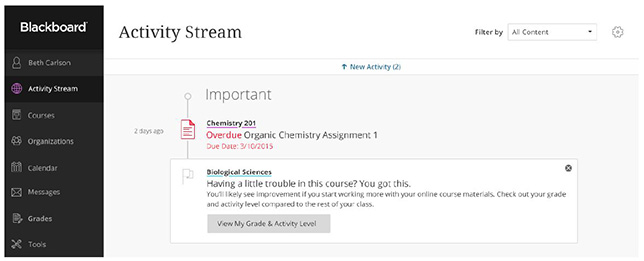
The Blackboard Learn Activity Stream
The notifications showed up for the students in the Blackboard Learn "Activity Stream," an interface that gives students and instructors information about their courses, such as assignments due. When a student clicks on a notification, he or she is shown a dashboard with detailed information, such as a chart that displays performance over time or illustrates the student's position relative to other students in the course.
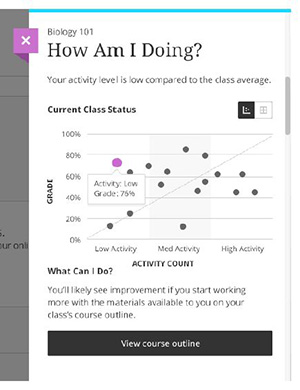
When a student clicks on a notification, he or she is shown a dashboard with detailed information, such as a chart that illustrates the student's position relative to other students in the course.
On average, stated a blog post about the research project, the notifications had an average open rate of 37 percent. This is considerably higher, the post noted, than the 22 percent of open rates for e-mails in education reported by e-mail service provider MailChimp.
Also, click rates suggested that alerts that shared information about student performance compared to others were of more interest to the recipients than more general notifications about how they were doing. Messages that declared students in the top 10 percent of the class or the bottom 5 percent had open rates 10 points higher than messages about grades rising or falling.
The highest open rate (42 percent) showed up for GradeInHighest messages; the lowest (24 percent) was for GradeDropped notifications.
Researchers Daniel Nasiatka, John Whitmer and Timothy Harfield said the results made sense to them. "Information about activity relative to others is not something that students would otherwise have access to (in contrast to personal grade trends, which students can easily monitor themselves)," they wrote, adding that they also found the outcome "exciting." After all, they pointed out, "Students who check their activity relative to others have been found to be 1.5 times more likely to earn a grade of C or higher in research conducted by the University of Maryland, Baltimore County."
The report is available on the Blackboard website here. A blog post recapping the results is here.
About the Author
Dian Schaffhauser is a former senior contributing editor for 1105 Media's education publications THE Journal, Campus Technology and Spaces4Learning.