When Too Much Data Gets in the Way of Decision-Making
For university leaders in need of solid information, often the problem is that they have data in too many places and in formats that aren't helpful. Indiana University's solution uses virtualized data.
- By Dian Schaffhauser
- 07/13/17
Coming to agreement and making decisions in a campus environment where data grows like Steve McQueen's blob can be an exercise in futility. When you think you've got just the right information to make your best business case, somebody else shows up at the meeting with facts that contradict your latest Prezi slide.
To address this challenge, a project at Indiana University in play since January 2015 intends to improve its leaders' abilities to make decisions by providing a single, comprehensive "data fabric" that will allow users to view what they need and provide consistent reporting across units at executive levels.
"If you ask how many people work at the university, well, depending on who you ask and how you ask the question and what time of year you ask the question, you may get different results," asserted Chief Data Architect Dan Young. "That becomes frustrating to decision-makers, whether it's counting staff or students or finances, to [realize], 'Hey, none of these numbers match up. Who do I believe?'"
Under IU's Decision Support Initiative (DSI) the data is gathered up, standardized and put into visual form for the users. The output has already begun helping people like deans of schools, department chairs and the provost "sing from the same hymnal," Young noted.
Virtualize the Data
As Young sat down to map out how DSI might be technically implemented, he grappled with a problem that besets any data solution: addressing the fact that source systems and user requirements can quickly change. He knew he wanted to adopt the practices of agile business intelligence for their emphasis on rapid value delivery and close business collaboration. But another question to be answered was whether the "presentation of the data" could be abstracted from the "data grinder" — separating the messy plumbing from the attractive user experience.
That's when Young came across the concept of "data virtualization." While he thought it was interesting stuff, he also figured it was probably too new within a university environment that tends to be somewhat cautious in its technology selections. Despite those reservations, the DSI team evaluated various products in the category, and the Denodo data virtualization platform came to Young's attention.
"Ultimately, we felt that Denodo was a very good fit for the things we would do," he recalled. "It supports a very broad range of data connectivity, and in practice we've successfully connected to all sorts of sources. Denodo does this very well." Also, it uses a security model that easily integrates with IU's use of Active Directory. Finally, Denodo's platform would support Young's vision of agile BI and the idea of a "logical data warehouse," allowing changes to sources, integrations or outputs to be made quickly.
How It Works
To get a new project started in DSI, the primary contact fills out a three-page PDF form online. This "DSI Charter" asks questions such as what's to be gained and lost by doing the project or not, what decisions need to be supported, what the project description and scope is, out-of-scope aspects, project metrics and how it will align with the university's "Bicentennial Strategic Plan." The latter is a gigantic vision with many moving parts that sets out IU's priorities for its third century in existence, which officially begins in 2020.
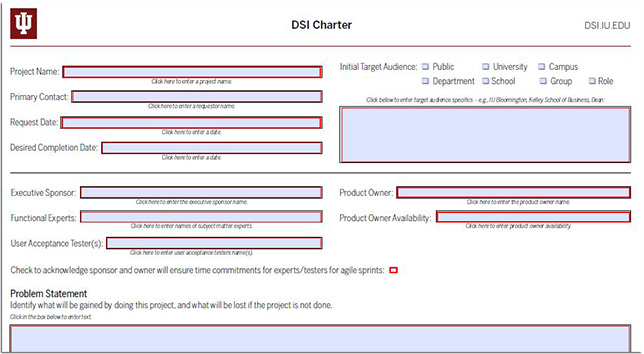
The DSI Charter
The proposals are prioritized by a steering committee based on breadth of impact. Frankly, Young said, those projects that are "really good" for a division won't necessarily receive the same reception as those that will "cover a broader university audience."
DSI is sticking with the basics for now. That means the data is coming from three primary sources as the starting place: the university's finance system, its human resources application and the student information system. But Young anticipates "branching out" to other data sources such as room scheduling and facilities management. In a recent conversation, one unit covered its interest in getting data from social media sites and the constituent relationship management system, to view those in contrast.
But that doesn't mean those DSI charters lower on the list have to wait in line. While the various visualizations produced by Young and his crew are the "end product," DSI also emphasizes the creation of "repeatable processes so we can sustain this long-term," he explained. A big aspect of that sustainability is helping others in the university to produce DSI "Mini-Mes." Those who wish to use the Denodo platform with their own data for mashups or data blending can be set up with their own virtualized databases. "We've had a really positive response from departments outside of DSI. This tool helps them solve data integration issues that they're facing and that we're not specifically focused on," said Young.
The sharing of riches extends to processes too. "As opposed to a top-down data governance strategy in which the CTO goes out and buys a metadata tool and says, 'Thou shalt do metadata governance,' and then nobody ever uses the tool, we're really working to bubble it up from the grassroots," Young said. "We show people what we're able to do, and if they like it, we really open the door to them to come in and partner with us, using the tools we've got."
The next step will be self-service, which will involve making the same data sets behind DSI reporting available to other users for slicing and dicing. That goal is supported by Denodo, which offers an interface that lets users perform searches and do data discovery against the contents of the data fabric.
The Proof Is in the Projects
Like a parent with many children, Young doesn't want to pick his "favorite" outcomes. But he will describe a couple of projects that are "really cool" for one reason or another. First, there's "Academic Metrics 360" (AM 360), a catalog of reports and dashboards that authorized users can access to view queries of interest based on the institution's huge stores of financial records and student data. For example, a Tableau-generated report examines majors vs. non-majors by credit hours. The data allows schools to view where their credit hours are coming from or going to. Having that information enables those in charge of a given school to see where their students are heading to earn their credits. As a hypothetical example, explained Young, if many business students are taking a digital design course from the School of Informatics, maybe it's time to offer something similar in the business school or team up with informatics to make that topic "an integral part of the curriculum."
According to the vice provost for strategic initiatives, M.A. Venkataramanan, that capability has helped the College of Arts and Sciences. "Visually, the dean and department chairs are able to see right now about 60 percent of their credit hours on the undergraduate level come from non-majors," he said. "When they realized it, they were able to come up with innovative programs aimed at non-majors in the form of minors and certificates." As a result, the university is already seeing an uptick in its finances and credit hours.
A second project that "isn't so technically flashy" but still worth sharing, said Young, is how the DSI has been able to influence business practice within the organization. For years, there have been two organizational hierarchies in operation at Indiana U: one for the academic organization and the other for financial management. DSI has enabled the university to "map" together these hierarchies, allowing academic courses to be associated with the financial organizations.
"This may not appear as great accomplishment," he admitted, "but this has been a long-term challenge for the university. When we tell veteran IU staff, 'Look at how we been able to map the organization,' they don't believe us." This particular mapping effort "wasn't necessarily a "technically difficult thing to do" Young added, but "DSI and the data fabric has given IU the platform to begin influencing organizational change. I think it's really beneficial."
Measuring Success
The project hasn't been without challenges. For one, the DSI version of data truth doesn't always sit right with schools and divisions that have been reporting numbers in their own fashion. But Young doesn't view that as a right-and-wrong situation so much as a chance to start a conversation. "They have data expertise as well," he said. "If we need to refine our visualizations to better suit what's actually happening in the university, that's great." In those situations, DSI serves as a platform for facilitating that discussion.
For another, data governance continues to pose problems, particularly around the issue of informal policies related to data access and security. "Departments may choose to be protective of data they have developed. They might even see those as proprietary," Young explained. "Trying to navigate those issues — whether ownership or politics — and figure out the appropriate level of data access among a distributed environment is a challenge."
Of course, the program has high-level sponsorship — something like this couldn't succeed without it. An organizational chart on the DSI site shows three VP-level people side-by-side at the top: Brad Wheeler, CIO and VP for IT; VP and CFO John Sejdinaj; and Joan Hagen, associate VP and university controller. The arrangement reflects the dual nature of DSI. While dealing with data has its technical aspects, the technology also is only "a means to the end," said Young. "The end is really to support the business." Or, as the project mission expresses it, the success of DSI "will be measured not by IT deliverables, but by better decisions made."